Tired of drowning in spreadsheets and struggling to extract meaningful insights from your data?
Key Takeaways
- 1Explore top YouTube videos for mastering Excel Pivot Tables.
- 2Transform raw data into actionable business intelligence.
- 3Learn fundamental data science and visualization techniques.
- 4Discover AI-powered tools for advanced data analysis.
- 5Gain a competitive edge with powerful data insights.
Who this is for
- If you're struggling to make sense of large datasets in Excel
- If you're a business analyst, student, or professional needing to analyze data efficiently
- If you're looking for practical, step-by-step video tutorials to boost your skills
Start Learning with AI-Powered Video Summaries
Get instant summaries, ask questions, and turn any video into an interactive study session.
Try Querivo Free →Understand the Foundation: Data Science for Actionable Insights
In our increasingly data-driven world, simply collecting information isn't enough. The real power lies in understanding what that data tells us. This first video lays the groundwork, introducing the core concepts of data science and how raw numbers can be transformed into truly valuable insights. It’s a crucial first step before diving into specific tools like Pivot Tables, helping you grasp why this analysis matters and the overall process involved.
You'll learn about the essential steps, from gathering and cleaning data to analysis, modeling, and visualization. Plus, it touches on the growing role of AI and machine learning in extracting deeper understanding, offering a glimpse into the future of data analysis. Ethical considerations are also brought up, which is pretty important when dealing with potentially sensitive information.
This video is great for anyone new to the idea of data science or those who want to solidify their understanding of the bigger picture. It sets the stage perfectly for learning specific tools by explaining the fundamental principles behind them.

- Grasp the fundamental principles of data science and its impact.
- Understand the essential steps in the data science process.
Visualize Your Data's Story with Tableau
Once you've got a handle on the data science fundamentals, the next logical step is making those insights understandable. This video dives into Tableau, a powerful tool for transforming your analyzed data into compelling visual stories. It’s not just about crunching numbers; it’s about presenting them in a way that makes them easily digestible and actionable for everyone, not just data experts.
You'll get a hands-on introduction to Tableau, learning how to connect to different data sources and create essential visualizations like bar charts to spot trends. The tutorial also highlights interactive features that let you explore data more deeply. Navigating the Tableau interface can feel a bit daunting at first, but this video breaks it down, showing you how to uncover hidden patterns and insights.
This is a fantastic resource if you're looking to move beyond raw data manipulation and learn how to communicate your findings effectively. While not directly about Excel Pivot Tables, mastering visualization techniques will massively boost the impact of your Pivot Table analysis.
- Learn to create compelling data visualizations with Tableau.
- Discover how to use interactive features to explore data deeply.
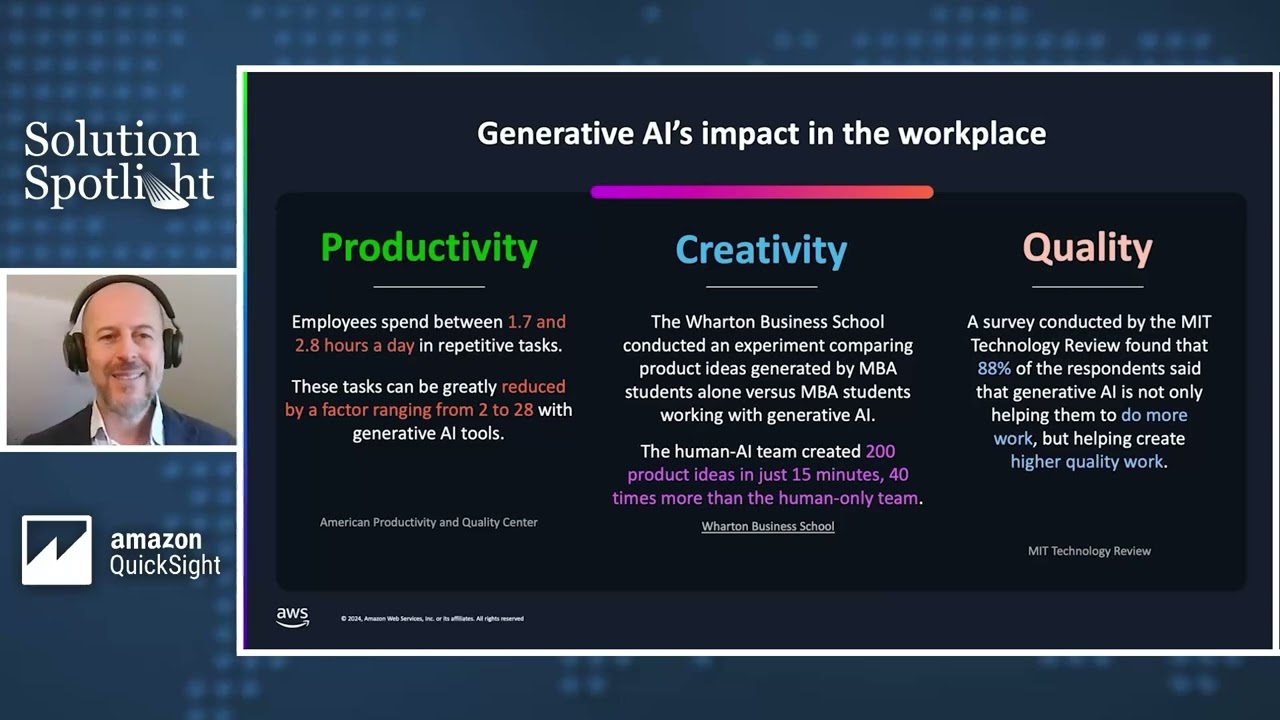
Boost Business Intelligence with AI-Powered QuickSight
Modern Business Intelligence (BI) tools are increasingly leveraging AI to make data analysis more streamlined and accessible. This video introduces Amazon QuickSight, highlighting how it consolidates various BI use cases into a single, scalable platform. It’s a look at how advanced tools can complement and enhance what you can do with something like Excel Pivot Tables, especially when dealing with larger or more complex datasets.
A really exciting aspect covered is the integration of Generative AI through Amazon Q. This feature allows for natural language dashboard building and Q&A capabilities, essentially letting you talk to your data. The video explains how AI can boost productivity, creativity, and the overall quality of your BI processes. Plus, it touches on consolidating structured and unstructured data for richer, more comprehensive insights.
For anyone interested in the cutting edge of BI and how AI is democratizing data insights, this video is definitely worth watching. It showcases a powerful, cost-effective approach that moves beyond traditional analysis methods.
- Explore Amazon QuickSight as a unified, AI-powered BI platform.
- Understand how Generative AI (Amazon Q) enhances data analysis.
Revolutionize Your Lab with AI-Driven Data Insights
The impact of AI on data analysis extends far beyond typical business intelligence. This video explores how AI is transforming specialized fields, like scientific research, by automating tasks and centralizing data for accelerated insight generation. It’s a fascinating look at the broader implications of data analysis techniques and how they can be applied in diverse, high-stakes environments.
The concept of an "AI-driven lab" with a centralized digital core is explained, detailing how AI can aggregate and contextualize laboratory data. You’ll learn about the role of AI agents in automating routine tasks, which can significantly boost productivity for scientists. The video promises significant data insights and productivity gains through this kind of AI integration, really pushing the boundaries of what's possible.
While this might seem niche, it illustrates a powerful principle: AI and smart data aggregation can unlock crucial insights in any field. It’s inspiring to see how these advanced techniques are being used to accelerate discovery and decision-making, mirroring the goal of mastering Excel Pivot Tables for your own work.

- Understand the concept of an AI-driven lab and centralized data.
- See how AI agents automate tasks and boost productivity.
Your Next Steps
Mastering Excel Pivot Tables is a powerful skill, and understanding the broader landscape of data science, visualization, and AI-powered BI tools can amplify its impact. We've curated these videos to guide you through foundational concepts and advanced applications, empowering you to transform your data into strategic advantages.
Your Action Items
- ☐Pick one video from above and watch it on Querivo
- ☐Ask questions and check summaries while watching without breaking your flow
- ☐Use the AI chat to clarify confusing parts and deepen understanding
- ☐Come back for more curated videos on topics you want to master
Turn Any YouTube Video into an Interactive Lesson
Paste any video link, get an instant AI summary, and ask questions in real-time.
Try Querivo Free →Related Videos You Might Enjoy
Looking for more perspectives on this topic? Here are some additional videos worth checking out:
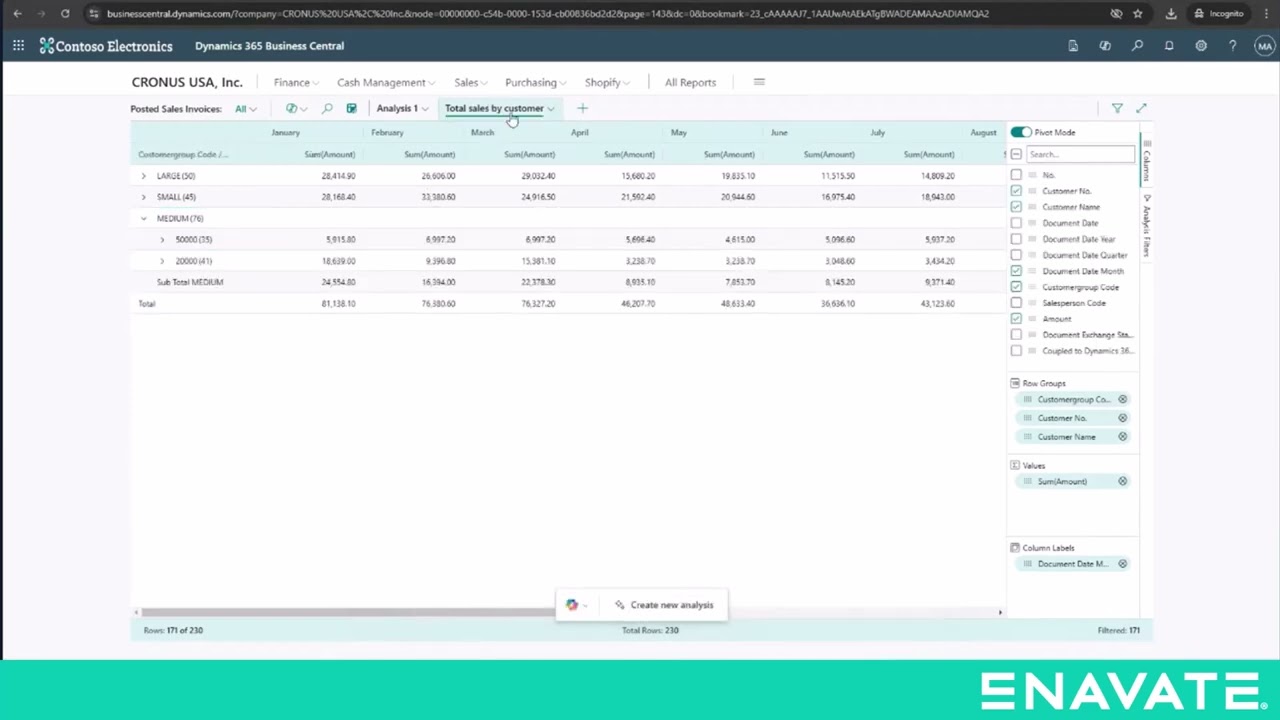
Unlock Data Insights with Copilot in Business Central
This video demonstrates how to leverage Copilot within Business Central's Analysis Views to quickly generate and refine data insights. Viewers will learn to ask natural language questions and transform complex data into easily digestible reports, eliminating the need for manual export to Excel.
Introducing the Cisco Time Series Model: Unlock Machine Data insights with Gen AI
The Cisco Time Series Model is a new open-weight generative AI foundation model designed for time series forecasting and anomaly detection in observability data. It aims to simplify the process by offering zero-shot capabilities, eliminating the need for extensive model tuning and maintenance, and providing high-accuracy predictions for proactive issue resolution.

Unlock Data Insights: 10 Best BI Tools Reviewed!
This video reviews the top 10 business intelligence (BI) tools for 2025, highlighting their key features, strengths, and pricing to help organizations transform data into actionable insights. It covers a range of tools from well-known platforms like Microsoft Power BI and Tableau to others suitable for various business needs and sizes.

Wren AI Feature Walkthrough: Unlocking Data Insights with Generative BI
This video provides a comprehensive walkthrough of Wren AI, an AI-powered business intelligence tool. It covers project setup, data connection and modeling (both manual and AI-assisted), natural language querying, customization options for accuracy, visualization generation, spreadsheet analysis, and API integration.