Feeling overwhelmed by data and statistics? You're definitely not alone. This curated guide cuts through the confusion by highlighting the absolute best YouTube videos for beginners to master essential data concepts and probability.
Key Takeaways
- 1Your essential guide to understanding statistics for beginners on YouTube.
- 2Learn core statistical concepts, probability, and data interpretation.
- 3Grasp descriptive vs. inferential statistics and key terminology.
- 4Visualize data with normal distribution and z-scores.
- 5Demystify hypothesis testing and common statistical tests.
Who this is for
- If you're struggling to grasp foundational statistical concepts for your studies.
- If you're an aspiring data scientist looking to build a solid understanding.
- If you're anyone needing to make sense of data in your personal or professional life.
Start Learning with AI-Powered Video Summaries
Get instant summaries, ask questions, and turn any video into an interactive study session.
Try Querivo Free →Unlock the Power of Statistics: Making Sense of the World Around You
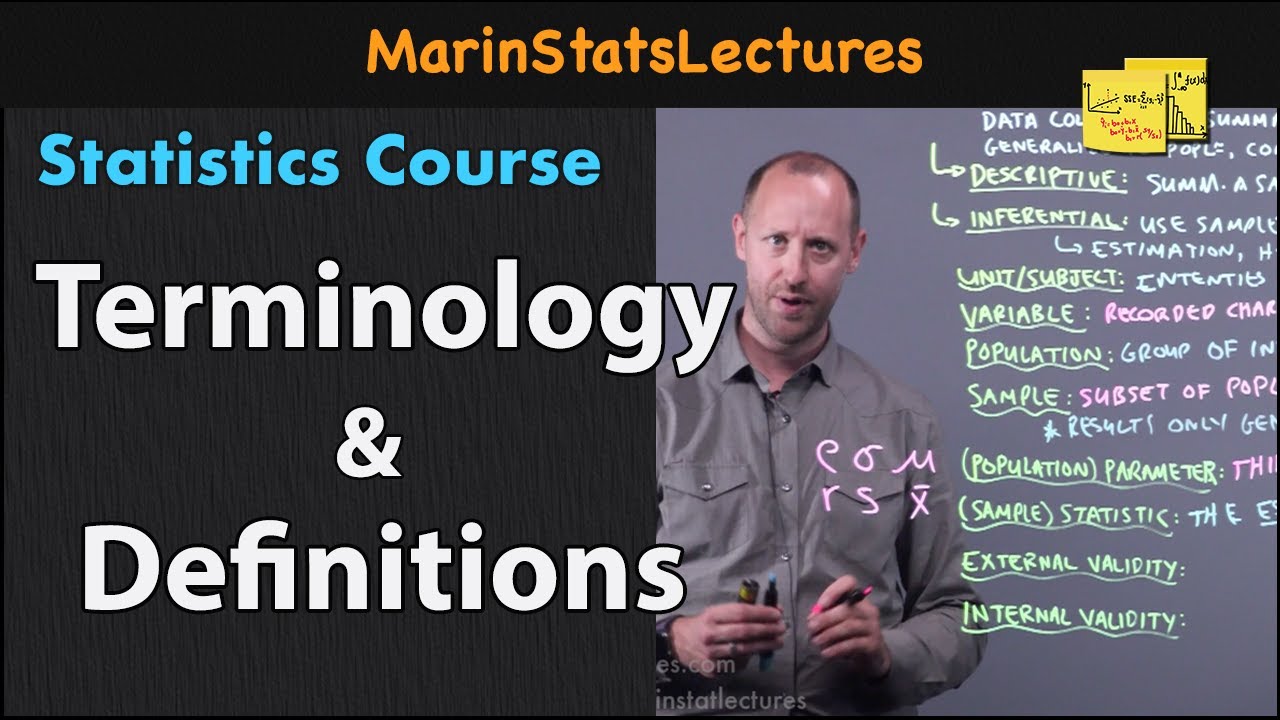
Statistics can feel daunting, but it's really just a powerful tool for understanding the world around us. In today's data-saturated environment, knowing how to interpret statistics isn't just for academics; it's a crucial skill for making informed decisions, whether you're looking at job market trends, scientific studies, or even just the ingredients on your food packaging. This video dives right into the essence of what statistics is all about.
It explains that statistics has two main meanings: the field of study itself, and the actual summarized data you end up with. More importantly, it clearly distinguishes between Descriptive Statistics, which is all about summarizing and describing data you have, and Inferential Statistics, which involves drawing conclusions or making predictions about a larger group based on a smaller sample. You'll see how these concepts apply to everyday examples, making the abstract suddenly feel very concrete and understandable. It’s surprisingly helpful for anyone new to the subject.

- Statistics is your guide to making sense of data and uncertainty.
- Grasp the core difference between Descriptive and Inferential Statistics.
Study This Video Deeper
Get an AI summary and ask questions about confusing parts in real-time.
Open in Querivo →Mastering the Language of Data: Essential Statistical Terms Explained
To truly understand statistics, you've got to speak its language. This video is a game-changer for beginners because it systematically breaks down the fundamental vocabulary that underpins all statistical analysis. Without a solid grasp of these terms, concepts can easily become muddled. It really reinforces the practical value of knowing these definitions.
You'll revisit the crucial distinction between descriptive and inferential statistics, but the real gem here is the clear, concise explanation of key terms. We're talking about Unit, Variable, Population, Sample, Parameter, and Statistic. Understanding these concepts is like getting the keys to the kingdom of data interpretation. Plus, it touches on generalizability and validity, which are critical for understanding the reliability of any statistical finding. This is definitely worth your time if you want to move beyond just "knowing stuff" to "understanding how it's known."
- Build your statistical vocabulary with essential definitions.
- Understand the difference between population parameters and sample statistics.
Visualize and Understand Your Data: A Gentle Introduction to Key Measures
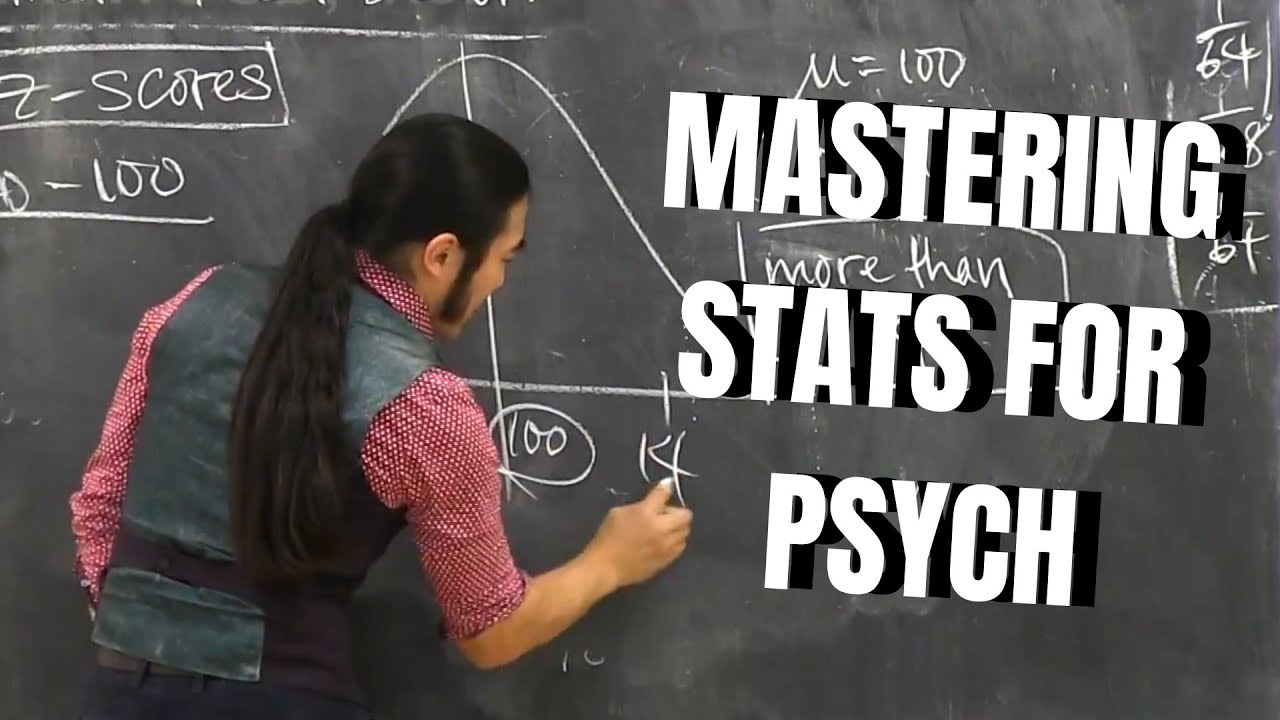
Now that you're getting a handle on the terminology, it's time to start looking at data itself. This video offers a fantastic, visual introduction to one of the most fundamental concepts in statistics: the Normal Distribution. It might sound technical, but you'll see how it describes so many natural phenomena. We're talking about things like heights, test scores, and even measurement errors.
The instructor breaks down its key properties – its symmetry, why the mean, median, and mode often align, and its asymptotic tails. Plus, you'll learn about the Empirical Rule (also known as the 68-95-99.7 rule), which is incredibly useful for understanding how spread out your data is within a normal curve. And then there's the practical application: standardizing data using Z-scores. This allows you to compare scores from different distributions, which is surprisingly helpful. Converting raw scores to z-scores makes a world of difference in interpretation.
- Visualize data distribution with the normal curve and the Empirical Rule.
- Learn to standardize scores using Z-scores for comparative analysis.
Demystifying Hypothesis Testing: Making Inferences with Confidence
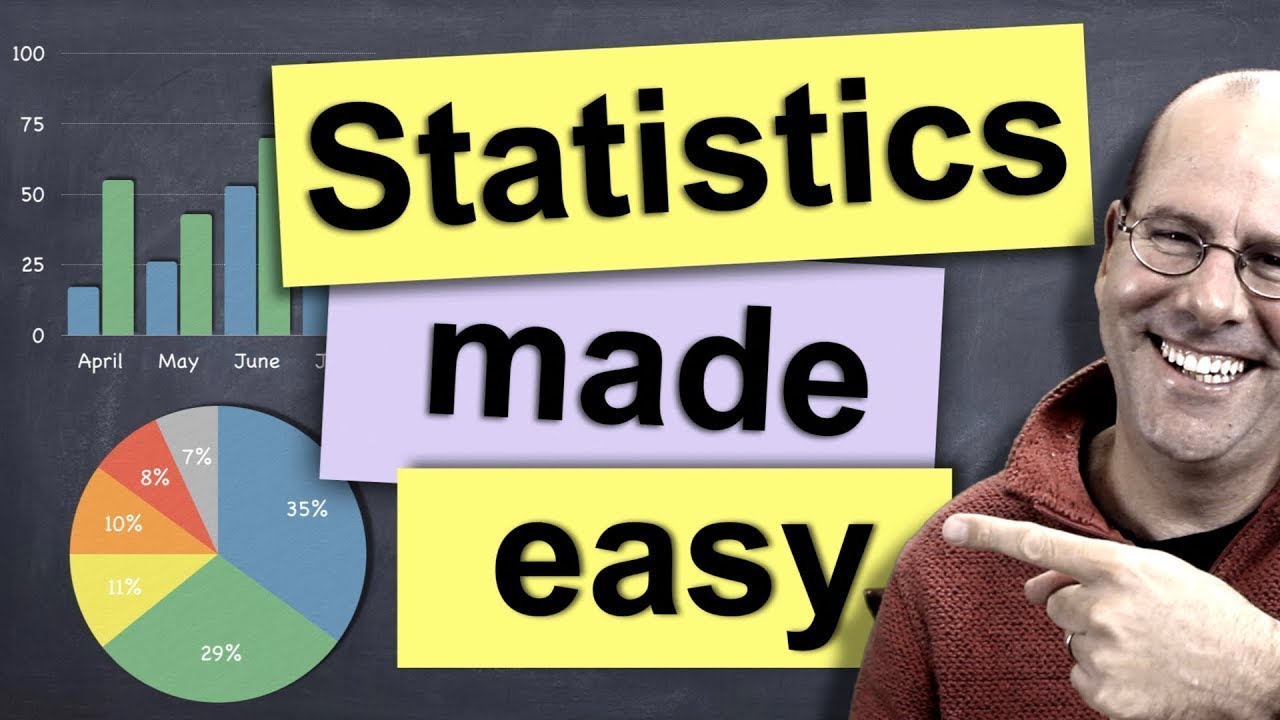
Ready to move from describing data to making actual inferences and testing theories? This video tackles hypothesis testing, a core component of inferential statistics, in a way that’s refreshingly accessible. The creator focuses on building an intuitive understanding rather than burying you in complex formulas, which we found really effective. You'll learn how to think about statistical data, differentiating between categorical and numeric variables, and how to summarize and visualize it to spot patterns.
What's particularly valuable here is the introduction to common statistical tests like the t-test, chi-square test, ANOVA, and correlation. It explains the underlying logic of hypothesis testing, including the concept of the null hypothesis and the all-important p-value. Understanding these concepts allows you to confidently assess whether the differences or relationships you observe in your sample data are likely to be real or just due to random chance. This is crucial for drawing reliable conclusions.
- Grasp the intuitive logic behind hypothesis testing and statistical significance.
- Get introduced to common tests like t-tests and chi-square.
Your Next Steps
You've just explored some of the most impactful YouTube videos to kickstart your statistics journey. By understanding the fundamental role of statistics, mastering its core terminology, and grasping key visualization and hypothesis testing techniques, you're definitely on your way to interpreting data with confidence.
Your Action Items
- ☐Pick one video from above and watch it on Querivo
- ☐Ask questions and check summaries while watching without breaking your flow
- ☐Use the AI chat to clarify confusing parts and deepen understanding
- ☐Come back for more curated videos on topics you want to master
These resources provide a solid foundation, making complex statistical concepts understandable and actionable. Keep exploring, and don't be afraid to dive into related topics like inferential statistics, standard deviation, and advanced hypothesis testing methods.
Turn Any YouTube Video into an Interactive Lesson
Paste any video link, get an instant AI summary, and ask questions in real-time.
Try Querivo Free →Related Videos You Might Enjoy
Looking for more perspectives on this topic? Here are some additional videos worth checking out:
Statistics in 10 minutes. Hypothesis testing, the p value, t-test, chi squared, ANOVA and more
This video provides a 10-minute overview of fundamental statistical concepts, focusing on hypothesis testing and the interpretation of p-values. It explains how to use common statistical tests like the t-test, Chi-squared test, and ANOVA to determine if observed differences in a sample are statistically significant or likely due to chance.
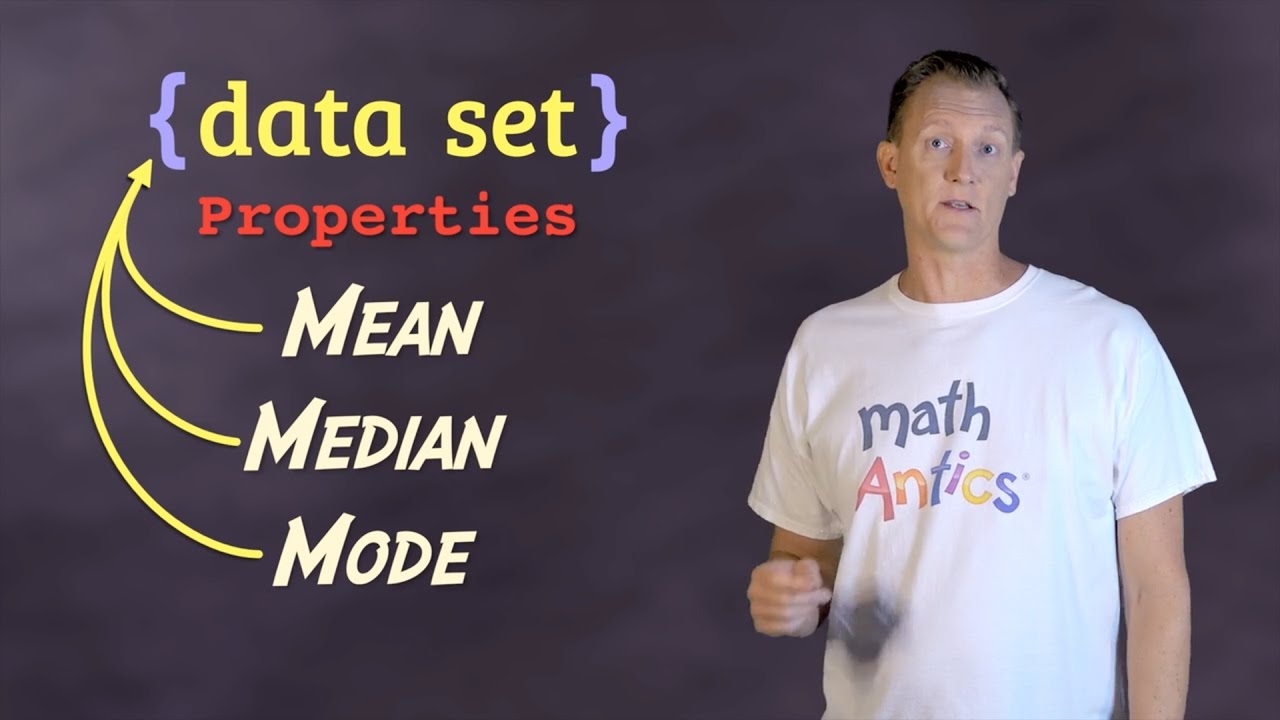
Math Antics - Mean, Median and Mode
This video explains how to calculate the Mean, Median, and Mode, which are three key properties used to understand data sets. It breaks down each concept with clear definitions and step-by-step examples, showing viewers how to find the average, middle value, and most frequent value in a collection of numbers.
Inferential Statistics FULL Tutorial: T-Test, ANOVA, Chi-Square, Correlation & Regression Analysis
This video provides a plain-language explanation of inferential statistics, differentiating them from descriptive statistics. It then introduces and explains common inferential tests like T-tests, ANOVA, Chi-Square, correlation, and regression, using practical examples for each.
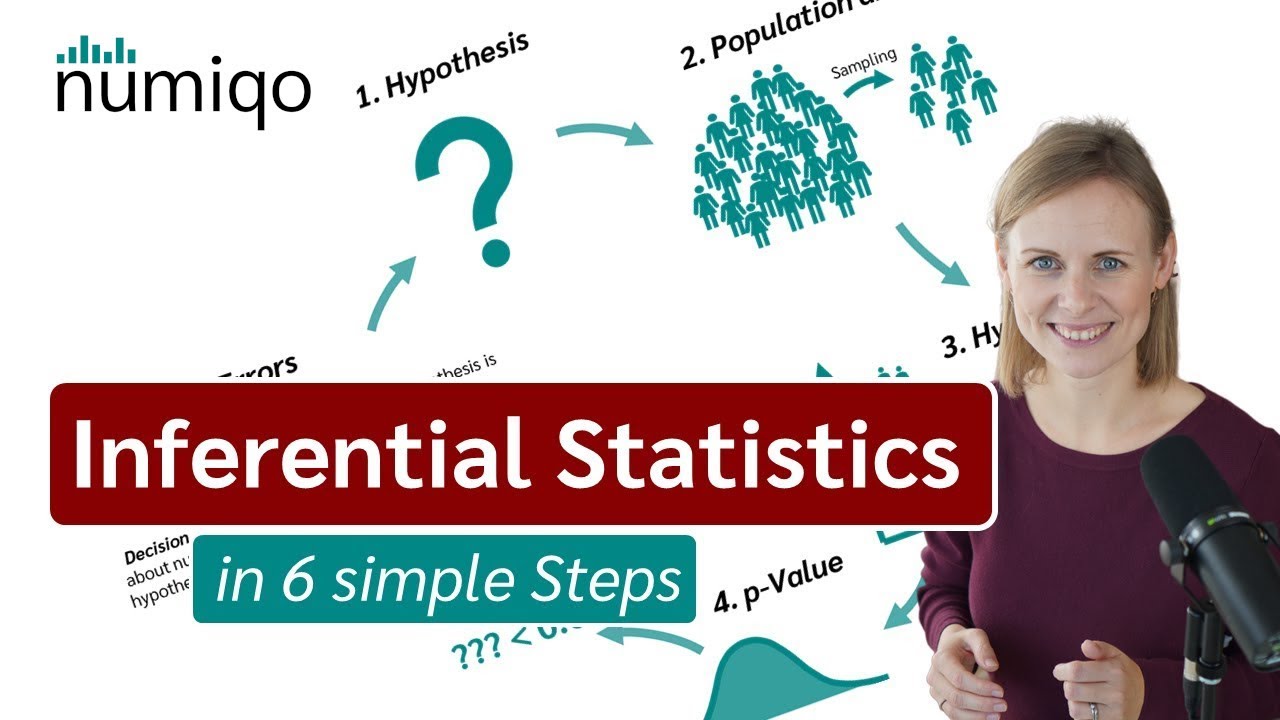
What is inferential statistics? Explained in 6 simple Steps.
This video explains inferential statistics by breaking down the process into six key steps: hypothesis, population and sample, hypothesis testing, p-value, significance, and errors. It clarifies the difference between population and sample and demonstrates how to use sample data to make inferences about a population, including understanding Type I and Type II errors.
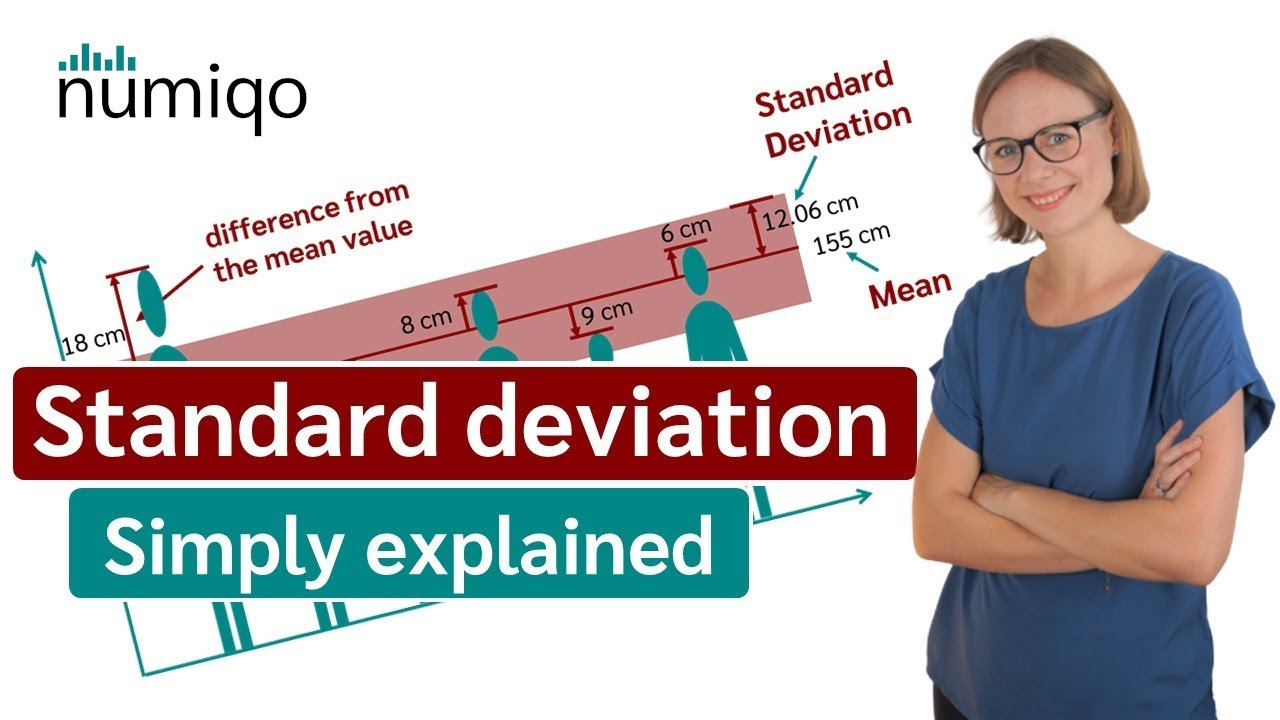
Standard deviation (simply explained)
This video explains what standard deviation is as a measure of data scatter around the mean. It details how to calculate standard deviation, clarifies why two formulas exist (population vs. sample), and differentiates it from variance by highlighting its interpretability in the original data units.
Understanding Statistical Inference - statistics help
This video explains statistical inference as the process of drawing conclusions about a population based on data from a sample. It differentiates inference from descriptive statistics and highlights three key principles: sample representativeness, the inherent uncertainty, and the importance of sampling methods.
