Feeling lost when faced with numbers and data? You're not alone! Statistics can seem daunting, but it's the key to understanding the world around us. This guide will help you navigate the essentials with some of the best YouTube video series available.
Key Takeaways
- 1Discover top YouTube videos for learning statistics.
- 2Master core statistical concepts for beginners.
- 3Learn practical data organization and analysis techniques.
- 4Gain confidence in interpreting data.
- 5Unlock the power of data literacy for your studies or career.
Who this is for
- If you're struggling to grasp fundamental statistical ideas
- If you're a student needing clear explanations for exams
- If you're a professional looking to improve data analysis skills
Start Learning with AI-Powered Video Summaries
Get instant summaries, ask questions, and turn any video into an interactive study session.
Try Querivo Free →Unlock the Power of Data: Your First Steps into Statistics
Statistics might sound complex, but at its heart, it's all about making sense of the information that surrounds us. The video "What Is Statistics: Crash Course Statistics #1" dives straight into the fundamental nature of statistics, explaining what it truly is: the science of understanding data through collection, organization, analysis, and interpretation. It's not just about numbers; it's about asking questions and finding evidence-based answers. You'll learn how to identify what makes a "statistical question" – one that genuinely requires data to be answered, rather than a simple lookup. Plus, you'll get a hands-on introduction to visually organizing data using dot plots. It’s a surprisingly effective way to start spotting trends like clusters, peaks, and gaps, giving you an immediate visual grasp of your data. This foundational understanding is crucial for anyone beginning their statistical journey.
- Statistics is the science of data: collect, organize, analyze, interpret.
- Learn to identify 'statistical questions' and use dot plots for visual organization.
Grasping the Big Picture: Descriptive vs. Inferential Statistics
Understanding statistics boils down to two major branches: descriptive and inferential. The video "Introduction to Statistics" by Anywhere Math breaks down these core concepts, clarifying what each branch focuses on and the unique types of insights they offer. Descriptive statistics, as the name suggests, is all about organizing, summarizing, and presenting data in a way that's easy to understand. Think numbers and graphs that paint a clear picture of what you have. On the other hand, inferential statistics is where things get really interesting – it’s about using a smaller sample of data to make predictions and draw conclusions about a much larger population. You’ll also get a solid grasp of key measures within descriptive statistics, like central tendency (mean, median, mode) and variability (range, standard deviation), which are essential for summarizing your findings. For any beginner, differentiating these two branches is a critical step in building a solid statistical framework.
- Descriptive statistics summarizes data (mean, median, mode).
- Inferential statistics uses samples to predict about populations.
Your Roadmap to Insight: The Data Analysis Process
Tackling data analysis can feel overwhelming without a clear plan. The video "Introduction to Statistics" by Anywhere Math offers a structured, five-stage process that acts as your roadmap, making any data analysis task feel much more manageable. It’s not just about crunching numbers; it's about approaching the problem strategically from start to finish. You’ll learn valuable strategies for collecting the right data from various sources, which is often half the battle. Plus, it emphasizes the crucial importance of data cleaning – that often-overlooked step that can make or break your analysis. By understanding the common tools and techniques for each stage, you'll be well-equipped to handle your own data projects with confidence. This is a practical guide that’s super helpful for anyone new to the field, providing a systematic approach to making sense of your data.
- Follow a clear 5-stage process for data analysis.
- Learn strategies for data collection and essential cleaning techniques.
Study This Video Deeper
Get an AI summary and ask questions about confusing parts in real-time.
Open in Querivo →Calculating with Confidence: Mean, Median, and Mode for Grouped Data
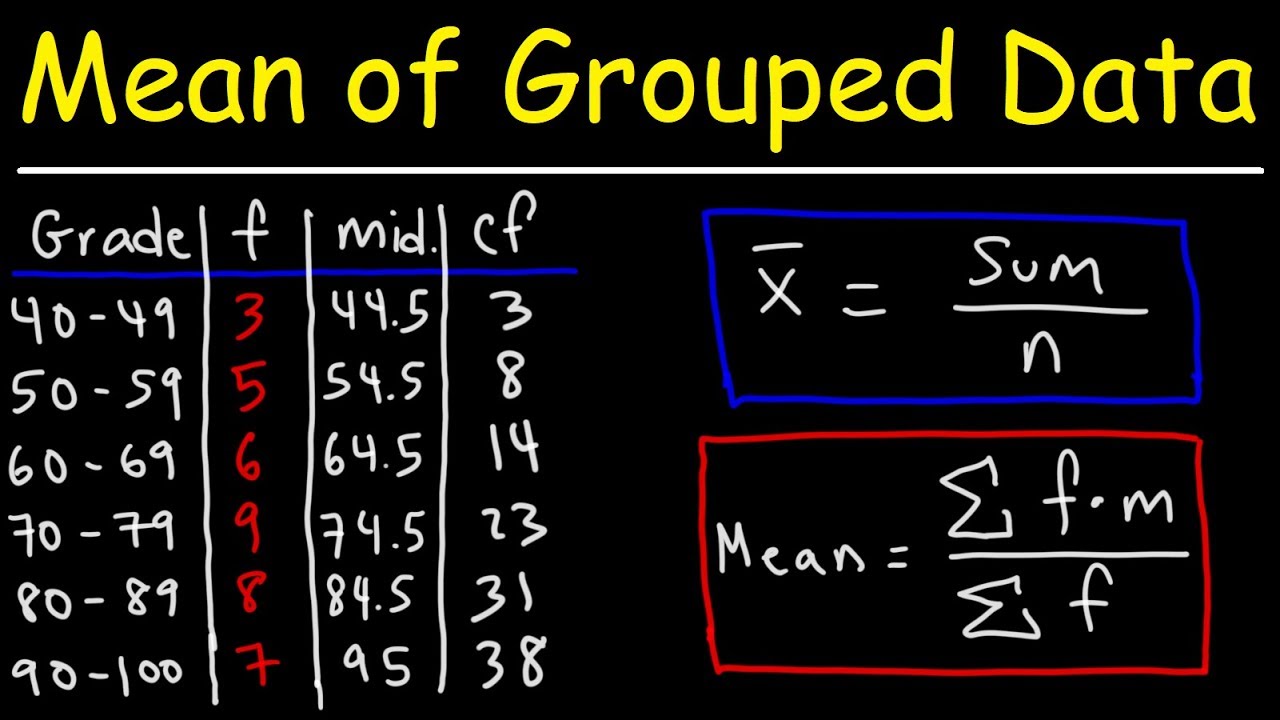
Sometimes, data isn't presented as a simple list of numbers but in frequency distribution tables. The video "Statistics made easy ! ! ! Learn about the t-test, the chi square test, the p value and more" by Global Health with Greg Martin dives into the practical calculations needed to understand data presented this way, specifically focusing on how to estimate central tendencies. You'll master working with these tables to uncover patterns you might otherwise miss. A key skill you’ll develop is learning to calculate the estimated mean of grouped data using interval midpoints – it's a neat trick that simplifies complex datasets. You'll also discover how to identify the specific intervals that contain the median and the mode for these grouped datasets. If you're looking to get hands-on with calculations, this video is definitely worth checking out, especially as it also touches upon crucial inferential concepts like the t-test, chi-squared test, and p-value.

- Master calculating mean, median, and mode for grouped data.
- Use frequency tables and interval midpoints for estimations.
- Gain exposure to key inferential statistics concepts.
Demystifying Hypothesis Testing and Key Statistical Tests
When you're ready to move beyond descriptive statistics and delve into making inferences, understanding hypothesis testing is paramount. The video "Statistics in 10 minutes. Hypothesis testing, the p value, t-test, chi squared, ANOVA and more" by Global Health with Greg Martin provides a rapid yet comprehensive overview of these essential concepts. It's an invaluable resource for quickly grasping the core ideas behind hypothesis testing, the significance of the p-value, and how tests like the t-test, chi-squared test, and ANOVA are used to draw conclusions from data. This video is perfect for a quick refresher or an efficient introduction to the fundamental tools of inferential statistics, helping you to understand how researchers and analysts test their ideas and interpret results.

- Understand the principles of hypothesis testing.
- Learn the meaning and importance of the p-value.
- Get introduced to t-tests, chi-squared tests, and ANOVA.
Your Next Steps
You've now explored the foundational building blocks of statistics, from defining the field and organizing data visually to understanding the core branches and the practical steps involved in data analysis. With these beginner-friendly YouTube video series, complex statistical concepts are now definitely within your reach. By watching these videos, you'll not only grasp the theoretical underpinnings but also learn practical techniques you can apply immediately.
Your Action Items
- ☐Pick one video from above and watch it on Querivo
- ☐Ask questions and check summaries while watching without breaking your flow
- ☐Use the AI chat to clarify confusing parts and deepen understanding
- ☐Come back for more curated videos on topics you want to master
These resources provide a fantastic starting point for anyone looking to learn statistics for beginners on YouTube, offering clear explanations and practical examples. By actively engaging with the content and utilizing tools that aid comprehension, you'll build a strong foundation for your data literacy journey.
Turn Any YouTube Video into an Interactive Lesson
Paste any video link, get an instant AI summary, and ask questions in real-time.
Try Querivo Free →Related Videos You Might Enjoy
Looking for more perspectives on this topic? Here are some additional videos worth checking out:
Statistics for Psychology
Math Antics - Mean, Median and Mode
R programming for beginners – statistic with R (t-test and linear regression) and dplyr and ggplot
Mean, Median, and Mode of Grouped Data & Frequency Distribution Tables Statistics
This video tutorial demonstrates how to calculate the mean, median, and mode for grouped data presented in frequency distribution tables. It emphasizes that an exact mean cannot be calculated from grouped data, so an estimation using midpoints is employed. The tutorial also explains how to identify the intervals containing the median and mode.