Are you drowning in spreadsheets and struggling to make sense of your data? Imagine transforming complex datasets into clear, actionable insights with just a few clicks.
Key Takeaways
- 1Curated YouTube lessons to master Excel Pivot Tables.
- 2Learn to summarize, analyze, and present data effectively.
- 3Go from beginner basics to advanced data techniques.
- 4Unlock trends and patterns in your datasets.
- 5Drive better decisions with powerful Excel skills.
Who this is for
- If you're overwhelmed by large spreadsheets and need clarity
- If you're looking to boost your business analysis skills quickly
- If you're a student or professional aiming to impress with data insights
Start Learning with AI-Powered Video Summaries
Get instant summaries, ask questions, and turn any video into an interactive study session.
Try Querivo Free →Unlock the Power of Pivot Tables: Your Foundation for Data Insights
Feeling lost in a sea of numbers? This video is your essential starting point for understanding Excel Pivot Tables. It breaks down exactly what a Pivot Table is and, more importantly, why it's such a crucial tool for anyone working with data. You'll quickly grasp how Pivot Tables can transform messy spreadsheets into clear, digestible summaries.
The creator walks you through the core functionality, highlighting how Pivot Tables can be used to calculate, summarize, and analyze your data with remarkable speed. It’s not just about crunching numbers; it's about uncovering hidden trends and patterns that might otherwise go unnoticed. Plus, you'll see how easy it is to make direct comparisons, which is key for making informed business decisions.
This is where your journey into Excel data analysis truly begins. If you've ever looked at a huge dataset and felt overwhelmed, this video will provide a clear path forward. It’s a solid foundation for understanding how to leverage Pivot Tables effectively.

- Pivot Tables are essential for summarizing and analyzing data.
- Learn how to quickly identify trends and make comparisons.
Master 80% of Excel Data Analysis in 12 Minutes with Pivot Tables
Need to get results fast? This video offers a super practical, no-nonsense approach to using Pivot Tables for common business inquiries. It focuses on efficiency, starting with crucial data cleaning techniques like removing duplicates and filling in blanks. You'll see how preparing your data correctly sets you up for success.
Leila Gharani's efficient style means you'll be applying common Pivot Table functions, such as counting records, sorting data, and calculating percentages of totals, in no time. This isn't just about building a table; it's about interpreting that data to answer real managerial questions. You'll discover how to extract meaningful insights that actually matter in a business context.
This tutorial is perfect for those who want to see immediate practical applications. It proves that you don't need hours to start getting value from your data analysis efforts. You’ll be amazed at how much you can achieve with these core Pivot Table skills.
- Efficiently clean and transform your data before analysis.
- Quickly answer business questions using common Pivot Table functions.
From Raw Data to Powerful Insights: A Comprehensive Pivot Table Guide
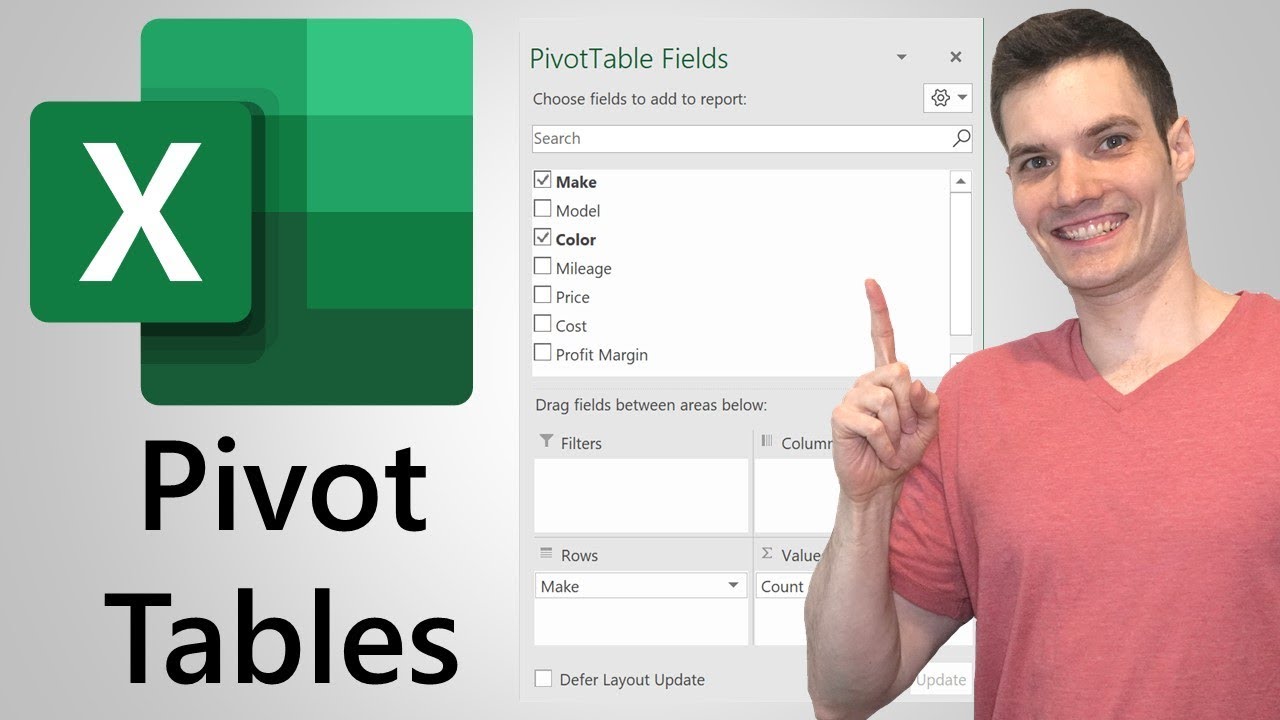
Ready to dive deeper into building and using Pivot Tables? Kenji Explains offers a truly comprehensive, step-by-step guide that makes the process crystal clear. This video is fantastic for understanding not just how to create a Pivot Table, but how to wield its power effectively.
You'll follow along as the creator builds Pivot Tables from scratch, demystifying the different fields like Rows, Columns, Values, and Filters. Understanding these components is key to generating insightful summaries and reports, even from the most complex datasets. The real-world examples used throughout make the learning process incredibly practical and immediately applicable to your own work.
This guide is a treasure trove for anyone who wants to master the mechanics of Pivot Tables. It’s about moving beyond basic summarization to creating reports that truly communicate your data’s story. You'll leave feeling confident in your ability to generate impactful insights. Learning Excel Pivot Tables is definitely a skill worth honing.
- Follow step-by-step instructions for creating insightful Pivot Tables.
- Master the use of Rows, Columns, Values, and Filters fields.
Beyond the Basics: Advanced Pivot Table Techniques for Deeper Analysis
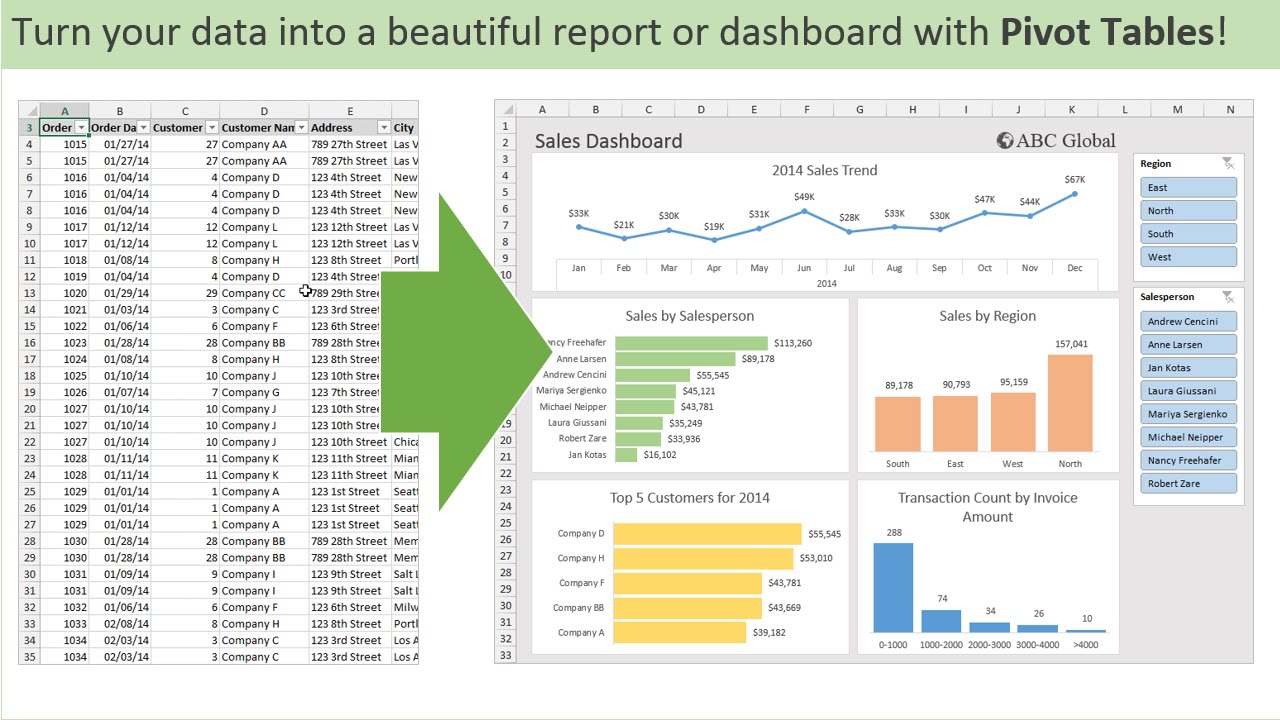
Once you’ve got the hang of the fundamentals, it’s time to unlock even more power with advanced techniques. This video takes your Pivot Table skills to the next level, enabling more sophisticated analysis and compelling data storytelling. You’ll discover how to push the boundaries of what you can do with your data.
The creator shows you how to create calculated fields and items, allowing for custom analysis that goes beyond standard aggregations. Want to make your reports interactive? You'll learn to use slicers and timelines, making data exploration dynamic and user-friendly. Plus, grouping data by dates or numbers can reveal patterns you might have missed.
And what's a data analysis without compelling visuals? This tutorial also covers leveraging Pivot Charts, transforming your summarized data into impactful charts that communicate your findings clearly. If you're serious about Excel data analysis and want to impress with your insights, these advanced techniques are a must-watch.

- Create custom calculations with calculated fields and items.
- Enhance reports with interactive slicers and timelines.
- Visualize data effectively using Pivot Charts.
Your Next Steps
By mastering Excel Pivot Tables, you can transform raw data into clear, actionable insights, driving better decision-making and improving your analytical efficiency. This guide has provided a roadmap from foundational understanding to advanced techniques.
Your Action Items
- ☐Pick one video from above and watch it on Querivo
- ☐Ask questions and check summaries while watching without breaking your flow
- ☐Use the AI chat to clarify confusing parts and deepen understanding
- ☐Come back for more curated videos on topics you want to master
Ready to unlock the power of your data? Start practicing with your own spreadsheets today! Continue exploring the related video resources for additional techniques and advanced applications. Experiment with the concepts learned in this article to solidify your understanding and become a Pivot Table pro.
Turn Any YouTube Video into an Interactive Lesson
Paste any video link, get an instant AI summary, and ask questions in real-time.
Try Querivo Free →Related Videos You Might Enjoy
Looking for more perspectives on this topic? Here are some additional videos worth checking out:
7 Advanced PivotTable Techniques That Feel Like Cheating

Master Data Analysis on Excel in Just 10 Minutes

Pivot Table Excel Tutorial
Create Pivot Tables In Excel | Use of Pivot Table - Pivot Table Tutorial
This video tutorial explains what a pivot table is in Excel and its uses for calculating, summarizing, and analyzing data. It demonstrates how pivot tables can reveal trends, patterns, and facilitate data comparisons.

Introduction to Pivot Tables, Charts, and Dashboards in Excel (Part 1)
10 Advanced Pivot Table Tricks to Make you an Excel PRO

Learn 80% of Data Analysis in Excel in Just 12 Minutes
This video teaches the core 80% of data analysis in Excel within 12 minutes by demonstrating four essential steps using an Olympic medal dataset. It covers data cleaning, transformation, analysis with pivot tables, and addresses common questions a manager might ask.