Feeling overwhelmed by charts, graphs, and numbers? You're not alone. In today's data-driven world, understanding statistics is no longer a niche skill – it's a superpower for making sense of information.
Key Takeaways
- 1Curated YouTube videos to master statistics basics.
- 2Learn to interpret data with confidence and clarity.
- 3Practical skills for students and professionals.
- 4Demystify complex concepts easily.
- 5Transform raw data into actionable insights.
Who this is for
- If you're struggling with statistics homework or coursework
- If you need to analyze data for reports or projects
- If you're a beginner looking to build a strong foundation in stats
Start Learning with AI-Powered Video Summaries
Get instant summaries, ask questions, and turn any video into an interactive study session.
Try Querivo Free →Grasp the Core: Descriptive vs. Inferential Statistics
Feeling lost when terms like "descriptive" and "inferential" statistics pop up? This video is a fantastic starting point. It breaks down the two main branches of statistical analysis in a way that makes immediate sense, helping you understand the fundamental purpose of each. You'll see why knowing the difference is crucial for interpreting data correctly.
This resource clarifies what descriptive statistics are all about – basically, summarizing and presenting your data so you can understand its basic features. Think averages and ranges. Then, it dives into inferential statistics, which is about using that data to make educated guesses or predictions about a larger group. It touches on key concepts like measures of central tendency and variability, giving you a solid overview of the statistical landscape.
It's a pretty solid introduction for anyone just starting out. Watch this video to get a clear picture of the foundational concepts that underpin all statistical analysis. You'll understand when to use which approach to get the insights you need.

- Distinguish between summarizing data (Descriptive) and making predictions (Inferential).
- Watch to grasp the basic purpose of each statistical branch.
Study This Video Deeper
Get an AI summary and ask questions about confusing parts in real-time.
Open in Querivo →Statistics Made Easy: Understanding Key Tests and P-Values
Ever heard of the t-test, chi-square test, or p-value and felt your eyes glaze over? This video is your friendly guide through some of those intimidating terms. It aims to make statistics feel a lot more approachable, especially for those new to the subject. You'll find it covers essential concepts that are frequently encountered in basic statistical analysis.
The creator really digs into how these tools help us understand data, particularly when comparing groups or looking for relationships. While the specifics of each test might take more practice, this video does a great job of demystifying what they represent and why they're important for data interpretation. It's definitely worth checking out if you want to get a clearer understanding of the building blocks of statistical testing.
This is a great watch for anyone starting their journey into statistics for beginners on YouTube. It provides a clear, albeit brief, introduction to concepts that are often central to understanding research findings.
- Learn the basic idea behind t-tests, chi-square, and p-values.
- Watch to gain a foundational understanding of statistical testing tools.
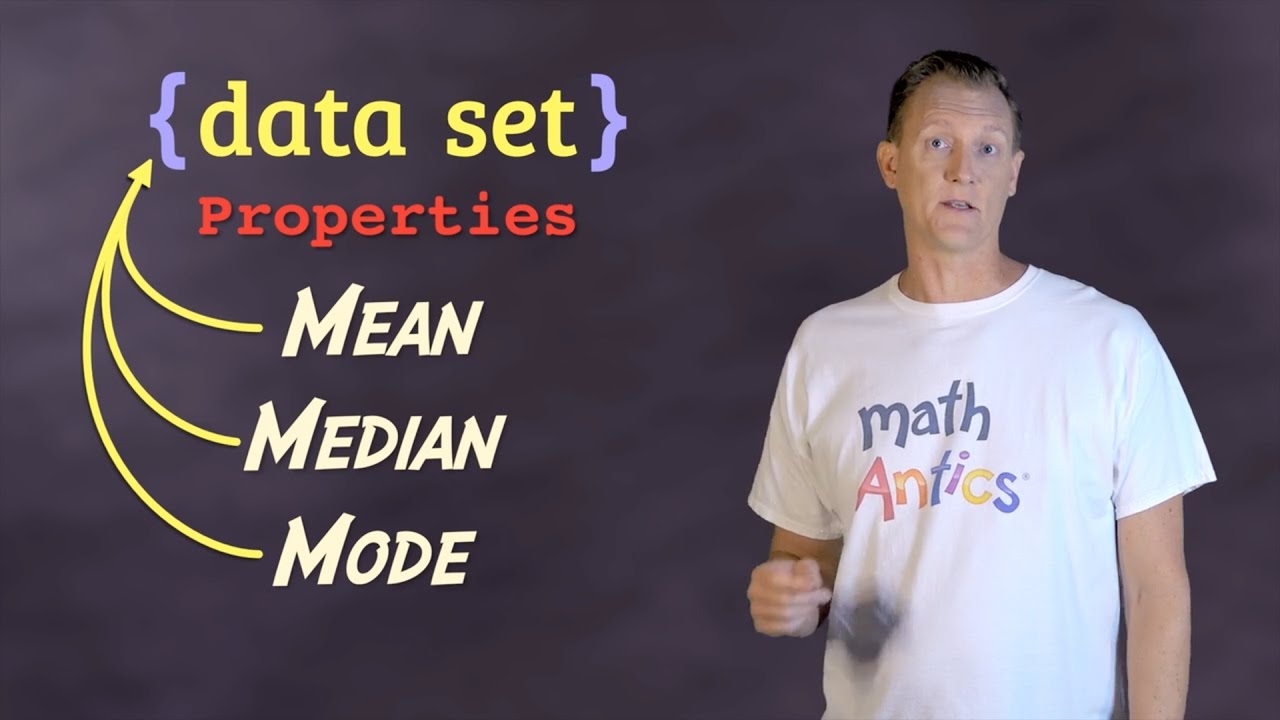
Mean, Median, and Mode Explained Clearly
Calculating the average is one thing, but what about the median and mode? This video from Math Antics is a real gem for understanding these fundamental measures of central tendency. If you've ever struggled to grasp how to find the middle value or the most frequent value in a dataset, this tutorial will clear things up beautifully.
The instructor takes a very visual and engaging approach, which is a huge plus when you're trying to learn basic statistics. You'll learn not just how to calculate the mean, median, and mode, but also why each measure is useful and when you might prefer one over the others. It's a foundational skill, and this video teaches it exceptionally well.
This is an excellent resource for anyone needing to understand the basics of data description. It's a clear, concise, and surprisingly fun way to learn these essential statistical concepts.
- Master calculating mean, median, and mode with clear examples.
- Watch to understand the difference and application of each measure.
Navigating the Data Analysis Journey Step-by-Step
Wondering how to actually do data analysis, not just understand individual statistics? This video offers a fantastic framework for approaching any data interpretation task. It breaks down the entire process into manageable stages, which is incredibly helpful for beginners who might feel daunted by the prospect of working with data.
The creator outlines five key steps, from defining your problem to cleaning and analyzing your data. This structured approach ensures you don't miss crucial early steps, like formulating a clear question or collecting data effectively. You'll get practical advice on how to start your analysis and what to look out for.
This video is a real game-changer for organizing your thoughts when tackling a data project. It shows you that data analysis is a process, and understanding that process is as important as knowing the statistical formulas themselves. It's a vital watch for anyone wanting to move beyond theoretical knowledge into practical application.
- Understand the structured five-stage data analysis process.
- Watch to learn how to define problems and start data collection.
Your Next Steps
By diving into these videos, you've taken a significant step towards confidently interpreting data. You've learned about the core branches of statistics, gained insight into key testing concepts, mastered fundamental measures like mean, median, and mode, and got a roadmap for the entire data analysis process.
Your Action Items
- ☐Pick one video from above and watch it on Querivo
- ☐Ask questions and check summaries while watching without breaking your flow
- ☐Use the AI chat to clarify confusing parts and deepen understanding
- ☐Come back for more curated videos on topics you want to master
These curated resources provide a robust foundation for anyone looking to learn statistics for beginners. Keep practicing and exploring, and you'll soon find yourself making sense of data like a pro.
Turn Any YouTube Video into an Interactive Lesson
Paste any video link, get an instant AI summary, and ask questions in real-time.
Try Querivo Free →Related Videos You Might Enjoy
Looking for more perspectives on this topic? Here are some additional videos worth checking out:
R programming for beginners – statistic with R (t-test and linear regression) and dplyr and ggplot
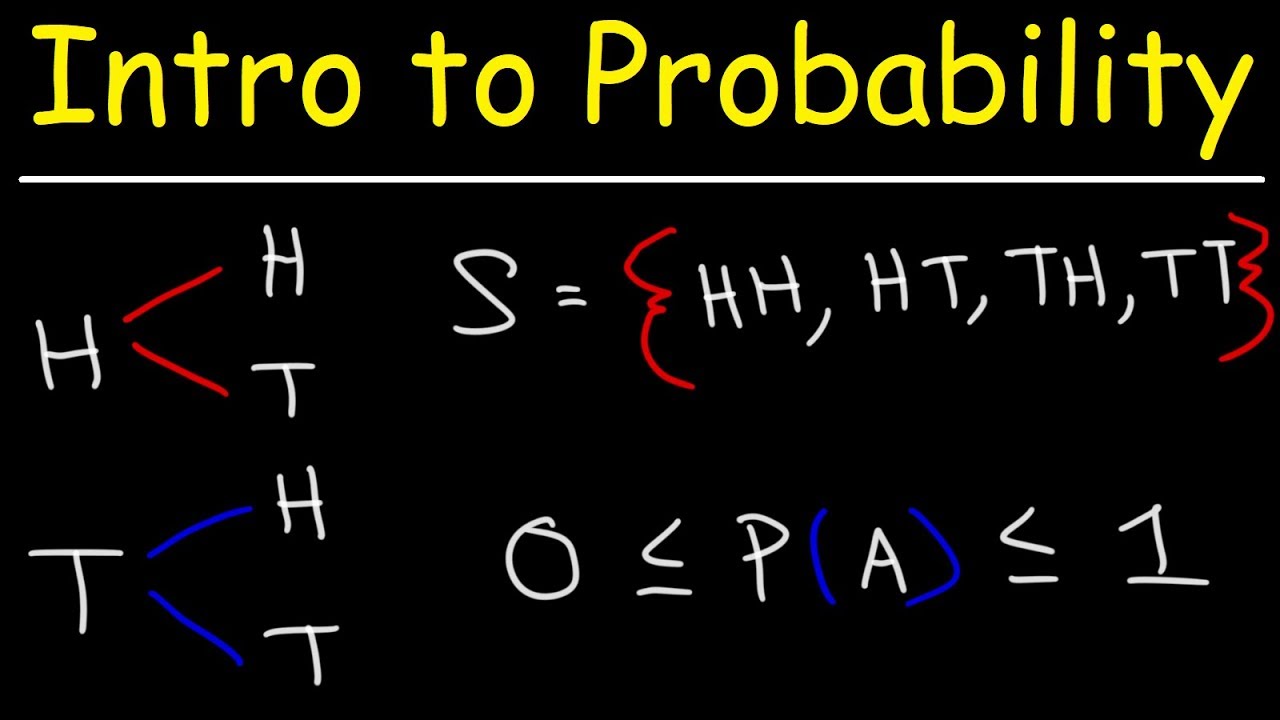
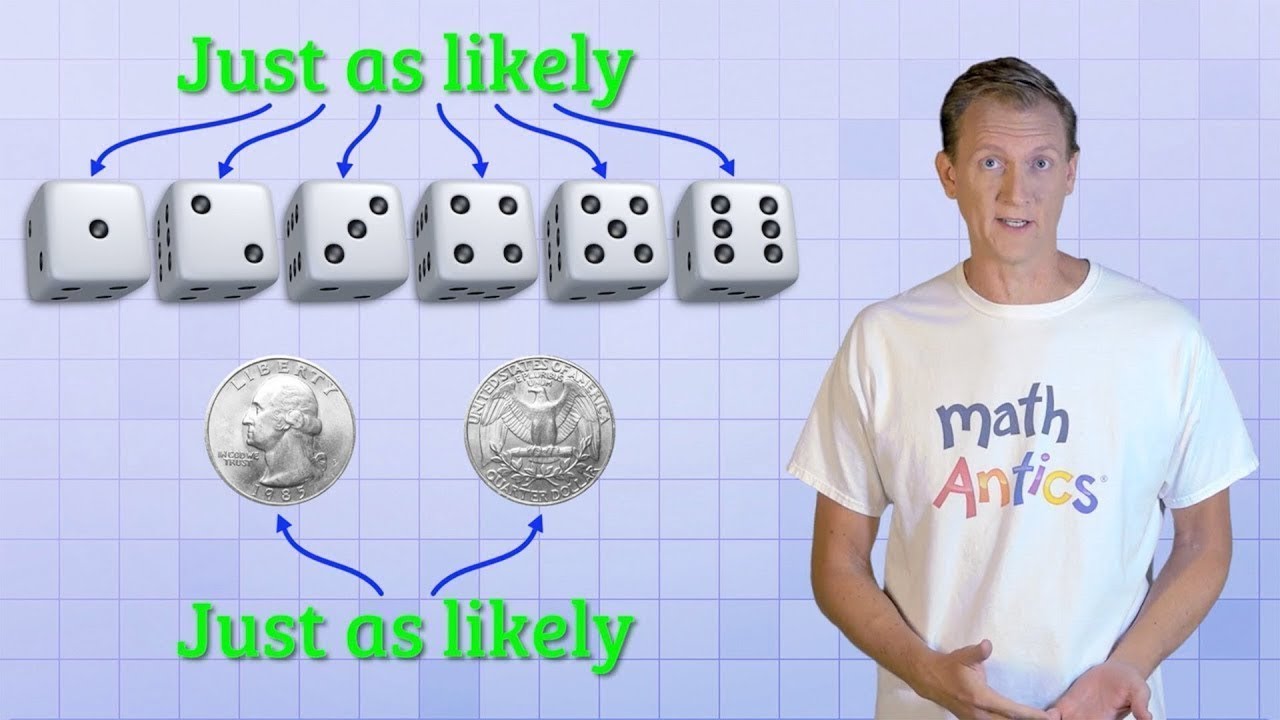
Math Antics - Basic Probability
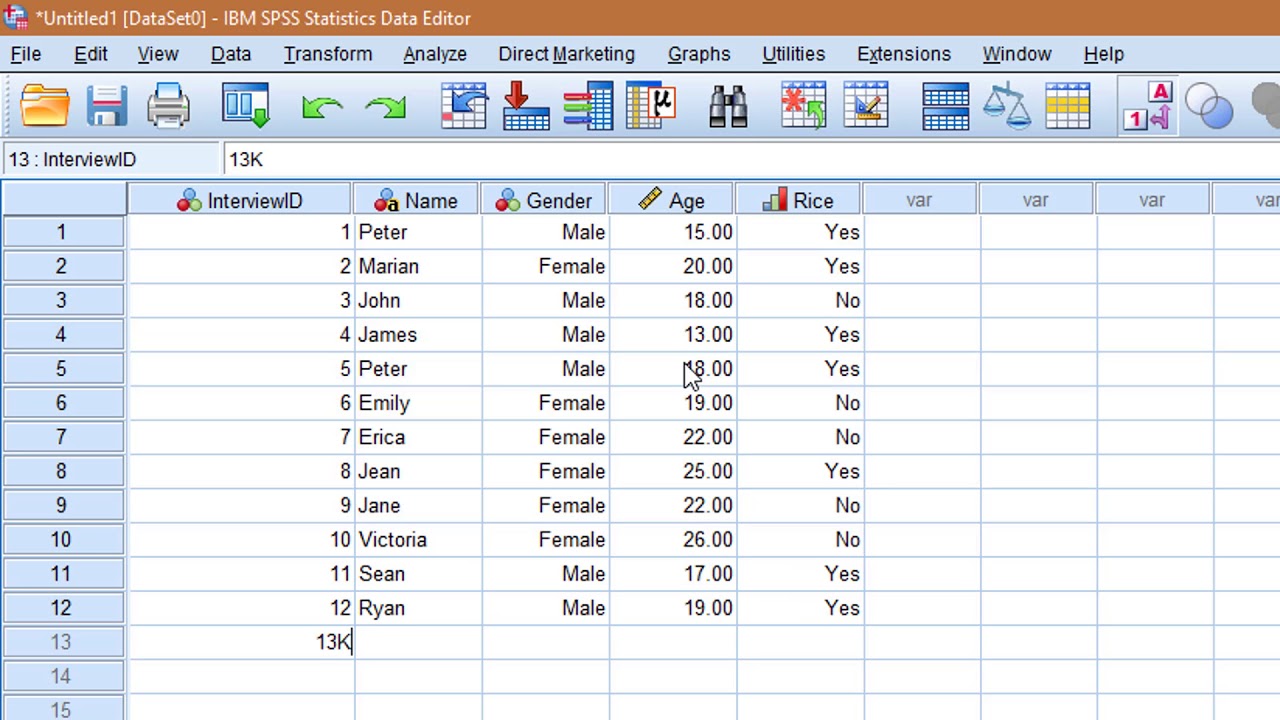
Learn SPSS in 15 minutes
This video provides a quick, hands-on introduction to SPSS, covering how to define variables, input data, and perform basic descriptive analysis like frequencies and summary statistics. It aims to get users operational with the software within 15 minutes.