Embarking on a journey into statistics can feel daunting, but what if you could master its core concepts with the help of engaging and clear YouTube tutorials? This guide curates some of the best video resources to help you build a robust understanding of statistics, no matter your starting point.
Key Takeaways
- 1Master fundamental statistics with top YouTube videos.
- 2Understand the full data analysis workflow.
- 3Grasp descriptive vs. inferential statistics.
- 4Unlock the power of probability and visualization.
- 5Build a solid foundation for data-driven insights.
Who this is for
- If you're struggling to grasp basic statistical concepts for your studies
- If you're an aspiring data scientist looking for practical foundational knowledge
- If you're a researcher needing to understand data analysis and interpretation
Start Learning with AI-Powered Video Summaries
Get instant summaries, ask questions, and turn any video into an interactive study session.
Try Querivo Free →Chart Your Course Through Data Analysis
Navigating the world of data can seem overwhelming at first, but understanding the entire data analysis process is key. This video breaks down the journey from identifying a problem all the way to uncovering valuable insights. You'll get a clear roadmap, making the often-confusing steps of data collection, cleaning, and analysis feel much more manageable.
This tutorial is a great starting point for anyone new to data science or analytics. It clearly outlines the five essential stages of the data analysis workflow, helping you define your objectives effectively. Plus, you'll learn about different data sources and practical techniques for ensuring your data is clean and reliable before you even begin crunching numbers. This foundational knowledge is crucial for any data-related project.

- Understand the complete 5-stage data analysis process.
- Start defining clear problem statements and gathering quality data.
Descriptive vs. Inferential Statistics: The Two Pillars of Understanding
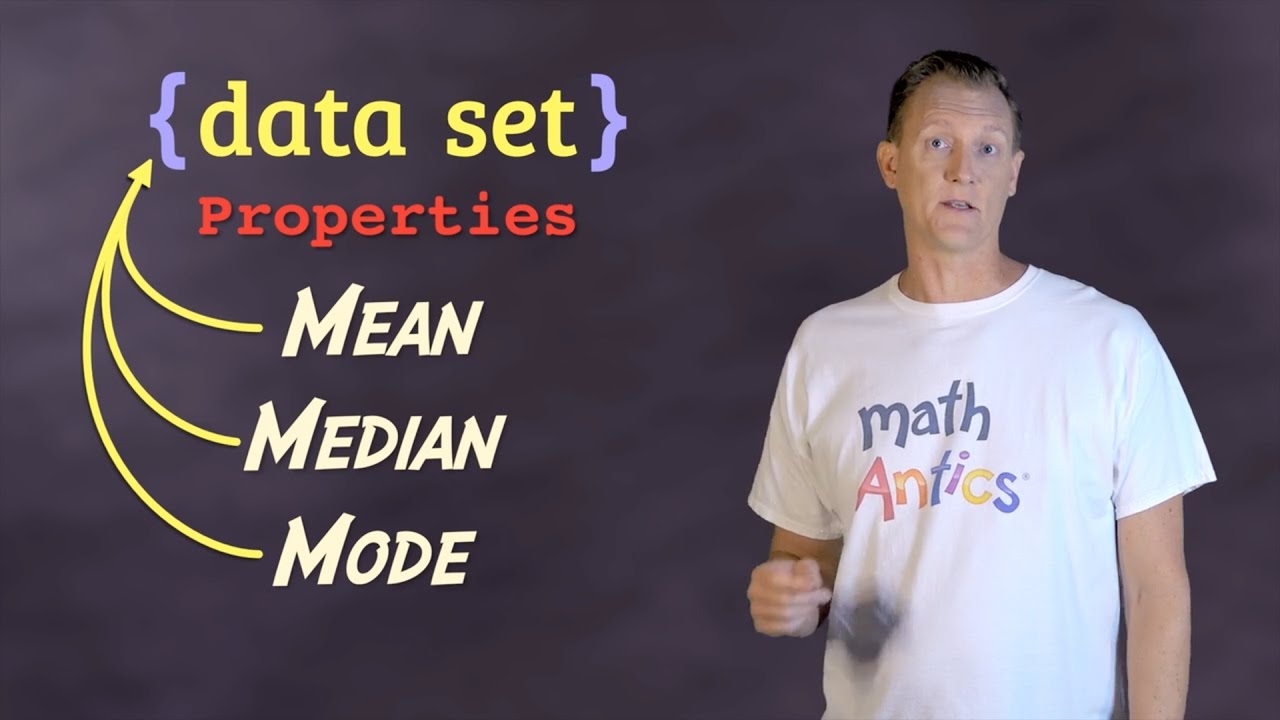
Statistics can be broadly categorized into two main branches, and understanding their difference is fundamental to interpreting data correctly. This video does a really good job of distinguishing between descriptive statistics, which helps us summarize and describe our data using measures like averages and ranges, and inferential statistics, where we use a smaller sample of data to make educated guesses and draw conclusions about a larger population.
You'll learn how to use measures of central tendency like the mean, median, and mode to get a feel for your data's typical values. Plus, it covers measures of variability—think range, variance, and standard deviation—which tell you how spread out your data points are. For anyone looking to move beyond just summarizing data to making predictions or drawing conclusions about a broader group, grasping these concepts is definitely crucial. It’s a surprisingly quick and clear way to get to grips with these core statistical ideas.
- Differentiate clearly between descriptive and inferential statistics.
- Grasp core concepts like mean, median, mode, and standard deviation.
Unlock the Power of Probability: The Foundation for Prediction
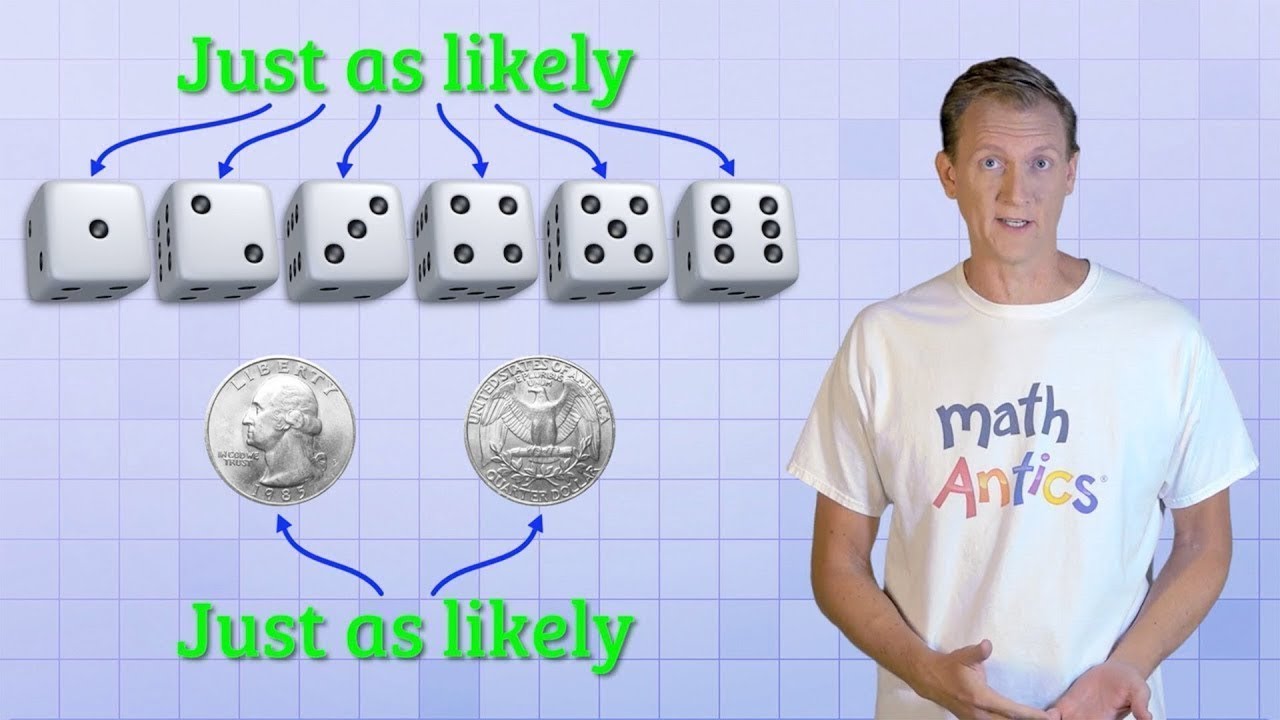
Probability is the bedrock upon which much of statistical inference is built, and understanding it is essential for quantifying uncertainty. This video serves as an excellent primer, explaining why understanding the likelihood of events is so important in statistics and in everyday decision-making. It makes the abstract concept of probability feel much more tangible and relevant, which is a significant advantage for beginners.
You'll get a handle on different types of probability and essential rules that govern how events interact. This knowledge is super helpful for quantifying uncertainty and making more informed decisions in various fields, from business to scientific research. Seriously, understanding probability helps you make better sense of random events and predictions, and this tutorial offers a clear, concise introduction to these vital principles.
- Understand the core definition and importance of probability.
- Learn how probability quantifies uncertainty and aids prediction.
Visualizing Your Data: Making Numbers Speak Through Charts
Raw data can be intimidating and difficult to interpret, but effective visualization turns complex numbers into understandable stories. This video highlights why charts and graphs are so vital in statistical analysis, helping you communicate findings clearly. It walks you through various visualization types, showing you exactly which ones to use for different kinds of data and the questions you're trying to answer.
Learning to interpret these visuals is a superpower for identifying trends, spotting outliers, and getting to the heart of what your data is trying to tell you. Whether you're presenting findings to stakeholders or just trying to make sense of a dataset yourself, mastering data visualization is a game-changer. It’s a practical skill that definitely pays off, and this resource makes it accessible for everyone.
- Recognize the power of visualization in statistical analysis.
- Learn to choose and interpret appropriate charts and graphs.
Your Next Steps
You've now explored the essential building blocks of statistics for beginners, from the complete data analysis process and the core differences between descriptive and inferential statistics, to the fundamentals of probability and the art of data visualization. These YouTube resources provide a clear and actionable path to understanding statistical concepts.
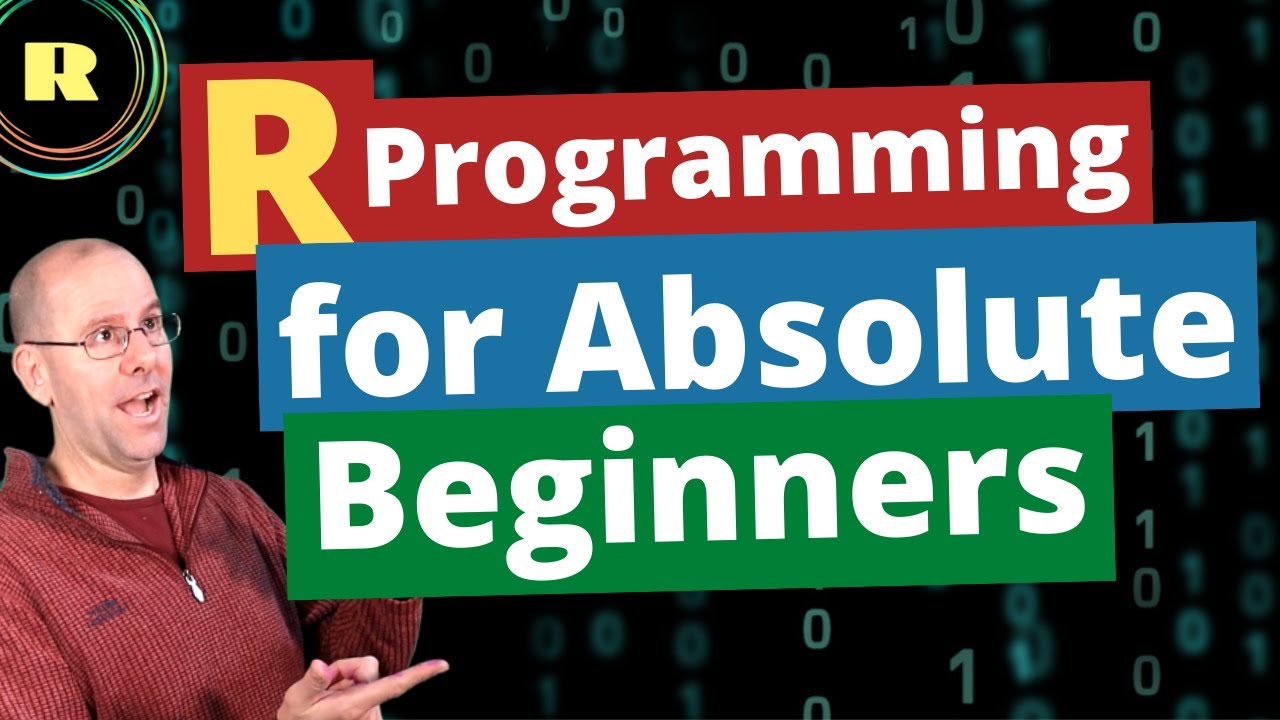
To truly solidify your learning, we recommend actively engaging with these videos. Don't just watch them passively; take notes, pause to ponder challenging concepts, and try to apply what you're learning. If you're working with specific software like R, the video "R programming for beginners – statistic with R (t-test and linear regression) and dplyr and ggplot" can offer practical experience with key statistical tests and data manipulation tools, making your learning even more hands-on. This particular video is valuable because it bridges theoretical statistical concepts with practical implementation in a widely-used programming language.
Your Action Items
- ☐Pick one video from above and watch it on Querivo
- ☐Ask questions and check summaries while watching without breaking your flow
- ☐Use the AI chat to clarify confusing parts and deepen understanding
- ☐Come back for more curated videos on topics you want to master
Ready to dive deeper? Start applying these concepts by analyzing a small dataset or trying out some basic statistical calculations yourself. The more you practice, the more confident you'll become!
Turn Any YouTube Video into an Interactive Lesson
Paste any video link, get an instant AI summary, and ask questions in real-time.
Try Querivo Free →Related Videos You Might Enjoy
Looking for more perspectives on this topic? Here are some additional videos worth checking out:
Math Antics - Mean, Median and Mode
Math Antics - Basic Probability
R programming for ABSOLUTE beginners
A Beginners Guide To The Data Analysis Process
This video provides a step-by-step guide to the data analysis process, breaking it down into five key stages. It explains each stage with practical examples and introduces various tools that can be used to undertake them, making data analysis accessible for beginners.