Unlock the power of data without spending a dime! Dive into the world of statistics with our curated guide to the best free YouTube tutorials.
Key Takeaways
- 1Master statistics basics free with curated YouTube videos.
- 2Learn descriptive, inferential, and probability concepts.
- 3Explore essential statistical tests and data analysis tools.
- 4Build practical skills for data science and informed decisions.
- 5Become statistically literate with zero cost.
Who this is for
- If you're struggling to grasp fundamental statistical concepts for your studies,
- If you're an aspiring data analyst looking to build a strong quantitative foundation,
- If you're a researcher needing to understand and interpret data more effectively,
Start Learning with AI-Powered Video Summaries
Get instant summaries, ask questions, and turn any video into an interactive study session.
Try Querivo Free →Grasp the 'Why' and 'What': Demystifying Statistics for Everyday Decisions
Ever feel overwhelmed by data, wondering how to make sense of it all? This video is your starting point, making the abstract world of statistics feel concrete and relatable. It's all about understanding how numbers can help us navigate our often uncertain world, from making purchase decisions to understanding societal trends. The creator grounds statistical concepts in everyday scenarios and historical anecdotes, making the subject less intimidating and more relevant for absolute beginners.
We'll see how statistics isn't just about complex equations; it's a powerful tool for thinking critically. This guide aims to show you precisely that. You'll learn to distinguish between the broad field of statistics and the actual data summaries, and crucially, grasp the fundamental differences and applications of descriptive versus inferential statistics. This foundational understanding is key to learning statistics for beginners YouTube has to offer. By watching this, you'll gain an appreciation for why statistics is essential for informed decision-making in various aspects of life.

- Statistics helps us make sense of data and decisions in uncertain situations.
- Watch this to understand descriptive vs. inferential statistics.
Study This Video Deeper
Get an AI summary and ask questions about confusing parts in real-time.
Open in Querivo →Demystify Key Statistical Tests: From t-tests to P-values
Moving beyond the basics, this tutorial tackles some of the more intimidating aspects of statistics: common tests and their meanings. You'll discover how to look at sample data and figure out if the differences or relationships you observe are actually significant, or just random chance. This video stands out for its 'statistics made easy!' approach, demystifying complex topics with clear explanations and relatable examples.
It’s surprisingly accessible, focusing on the intuitive reasoning behind tests like the t-test and chi-square test. Forget drowning in formulas; this video emphasizes the thinking behind hypothesis testing, the null hypothesis, and what that elusive p-value actually tells you. The creator focuses on building an intuitive understanding of statistical reasoning, making these concepts less intimidating for beginners. This is definitely one of the best statistics videos for building practical understanding of how to interpret study results.
- Learn to identify real differences and relationships in data samples.
- Understand the logic behind t-tests, chi-square tests, and p-values.
Build Your Foundation in Probability with Visual Aids
Probability is the bedrock of inferential statistics and so much more. This video offers a clear, visual introduction to its core concepts. You'll get a solid grip on what probability truly means, understanding its range from 0 to 1 and what those values signify. This is crucial for understanding how likely certain events are to occur, a concept fundamental to many fields.
The creator does a fantastic job illustrating outcomes using sample spaces and tree diagrams. Seriously, seeing all possible results laid out visually makes calculating the probability of specific events—that is, Favorable Outcomes divided by Total Outcomes—much more intuitive. This approach effectively breaks down complex ideas like sample space and probability calculation through clear examples, making it accessible for absolute beginners. It’s a game-changer for grasping probability tutorials on YouTube.
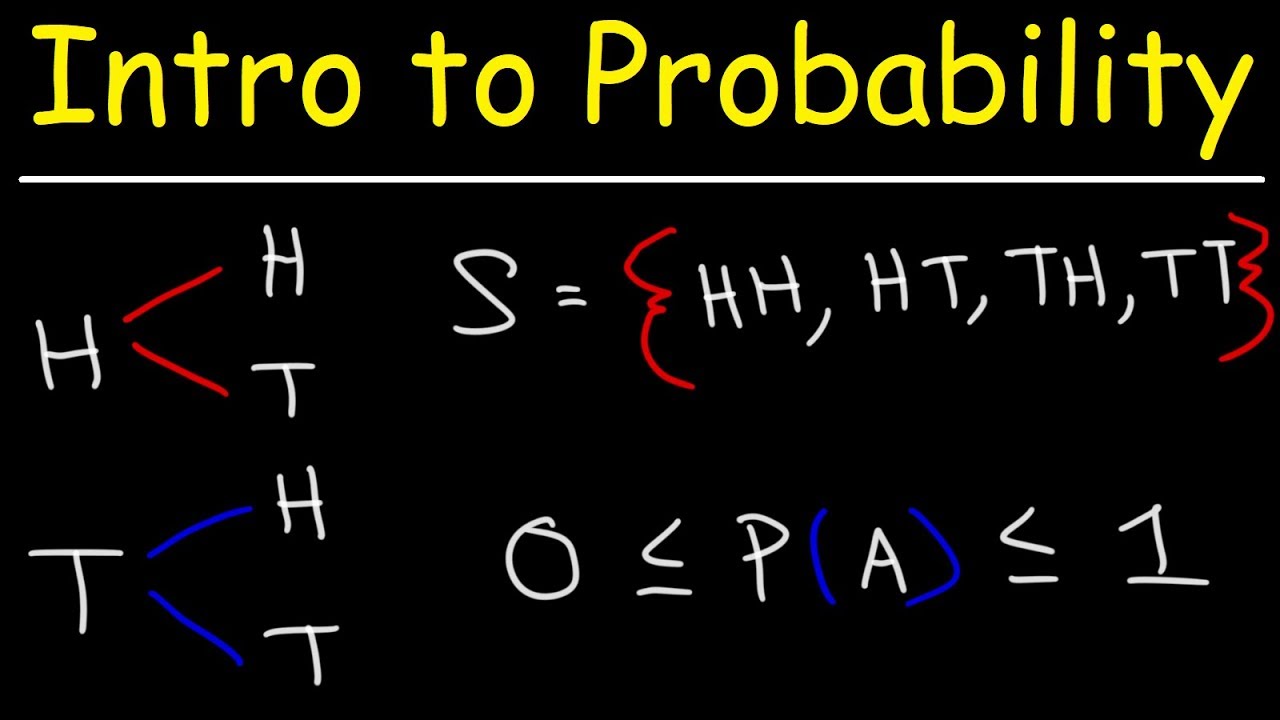
- Grasp the definition and range of probability (0 to 1).
- Visualize possible outcomes using sample space and tree diagrams.
Kickstart Your Data Analysis Journey: Essential Tools and Skills
So, you've got a handle on the statistical concepts. Now, what? This video is for anyone eager to translate that knowledge into a tangible skill: data analysis. It's aimed squarely at absolute beginners, cutting through the noise to focus on what truly matters when you're starting out in the field.
You'll get a clear picture of the core competencies – querying, cleaning, analyzing, and visualizing data. Plus, the creator offers practical advice on leveraging accessible tools like Excel and SQL as your first steps, rather than getting lost in more advanced programming languages right away. This video stands out by challenging the common notion that Python is the mandatory first step for aspiring data analysts, instead advocating for a foundational approach. The emphasis on practical projects and concrete free course recommendations is definitely worth noting for building a portfolio and gaining practical experience.
- Identify the essential skills needed for data analysis.
- Learn about beginner-friendly tools like Excel and SQL for data work.
Your Next Steps
You've learned that statistics is an accessible and essential skill, and with these free YouTube resources, you can master its core concepts, from probability to practical data analysis. Starting with a solid understanding of descriptive and inferential statistics, and then exploring probability and data analysis tools, sets you on a path to data literacy. These videos provide a robust, cost-free foundation for anyone looking to understand data better, whether for academic pursuits, career changes, or simply making more informed decisions in daily life.
Your Action Items
- ☐Pick one video from above and watch it on Querivo
- ☐Ask questions and check summaries while watching without breaking your flow
- ☐Use the AI chat to clarify confusing parts and deepen understanding
- ☐Come back for more curated videos on topics you want to master
Ready to transform your learning? With these fantastic, free YouTube tutorials, diving into statistics has never been easier.
Turn Any YouTube Video into an Interactive Lesson
Paste any video link, get an instant AI summary, and ask questions in real-time.
Try Querivo Free →Related Videos You Might Enjoy
Looking for more perspectives on this topic? Here are some additional videos worth checking out:
R programming for beginners – statistic with R (t-test and linear regression) and dplyr and ggplot
This video introduces R programming for beginners, covering essential statistical analysis techniques like t-tests and linear regression. It also demonstrates data manipulation with the dplyr package and data visualization using ggplot2, all with a practical, step-by-step approach using the Gapminder dataset.
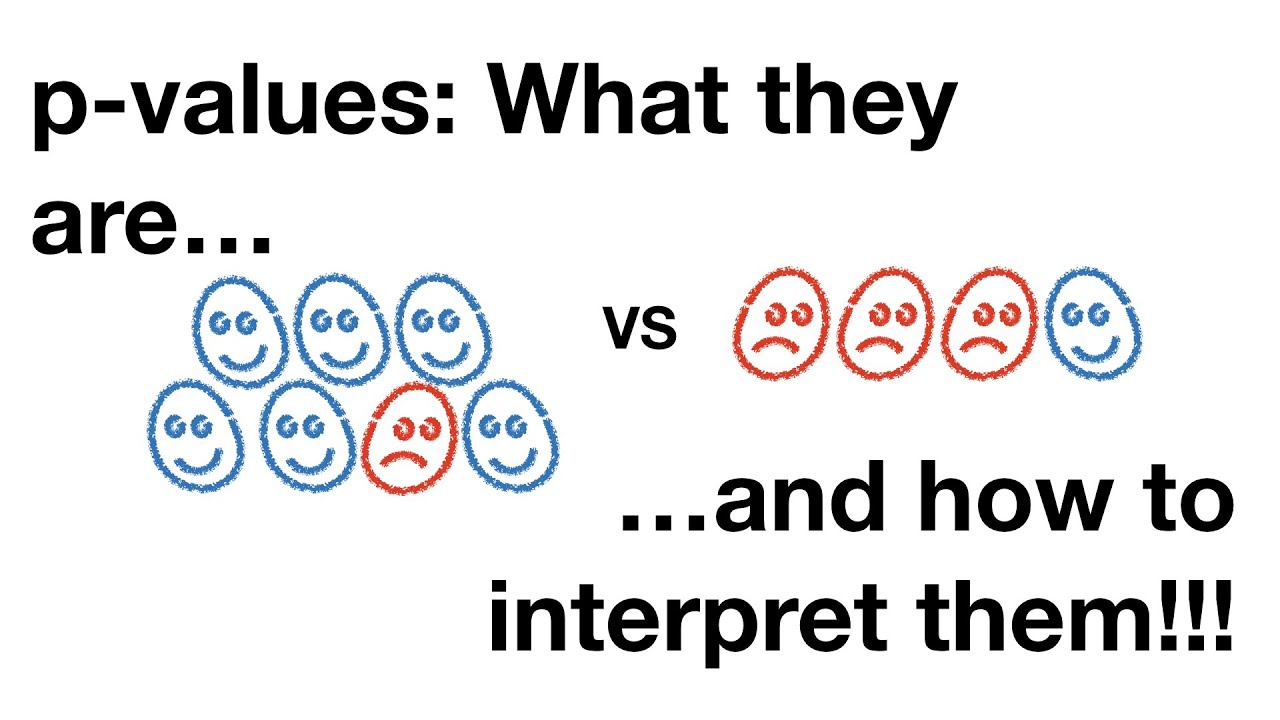
p-values: What they are and how to interpret them
This video explains p-values as a measure of confidence in determining if two groups or treatments are different, rather than just due to random chance. It clarifies that a small p-value (typically below 0.05) suggests a significant difference, while a larger p-value indicates a lack of confidence in that difference. The video also emphasizes that a small p-value does not indicate the magnitude of the difference.
Best Course to Learn Statistics for Data Analysis
This video recommends a specific Udemy course, "Statistics for Data Science and Business Analysis," as the best resource for learning statistics for data analysis. The instructor emphasizes that while not immediately essential, statistics knowledge becomes crucial for career advancement in data analysis.
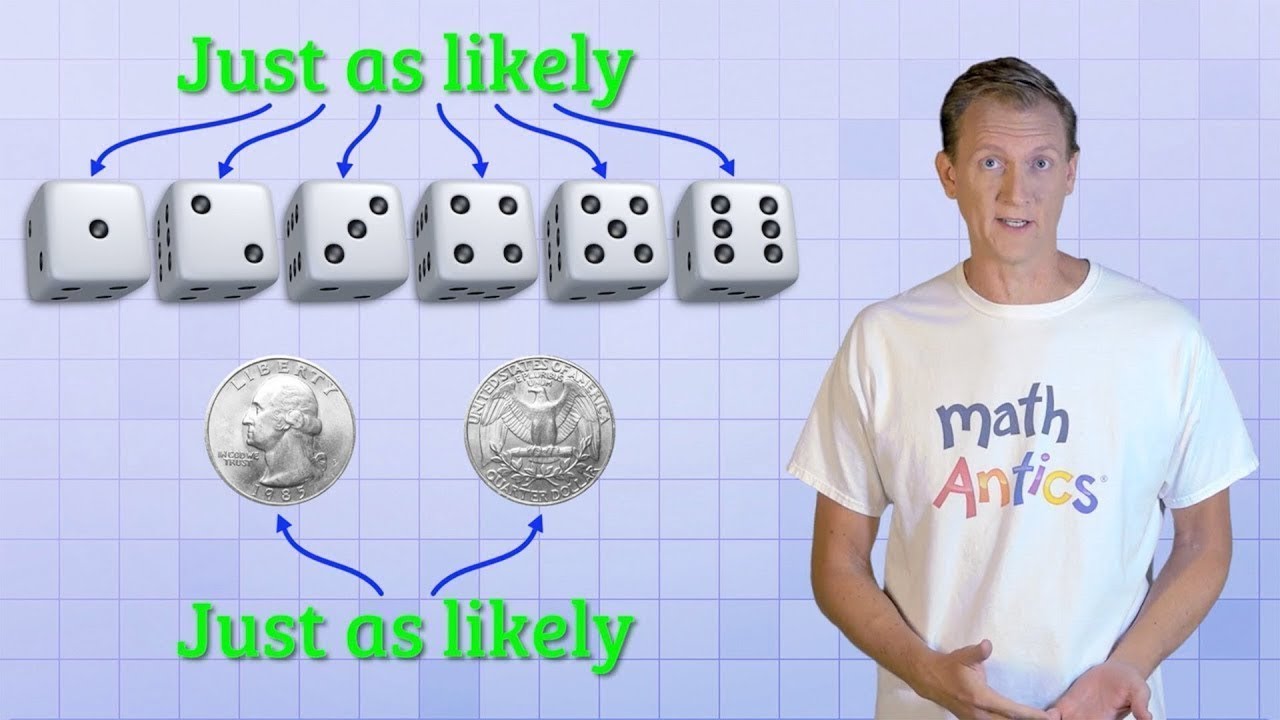
Math Antics - Basic Probability
This video introduces the concept of probability as a measure of how likely an event is to happen. It explains how to calculate basic probabilities using examples like coin tosses, dice rolls, and spinners, and visualizes these probabilities on a number line from 0 (impossible) to 1 (certain).
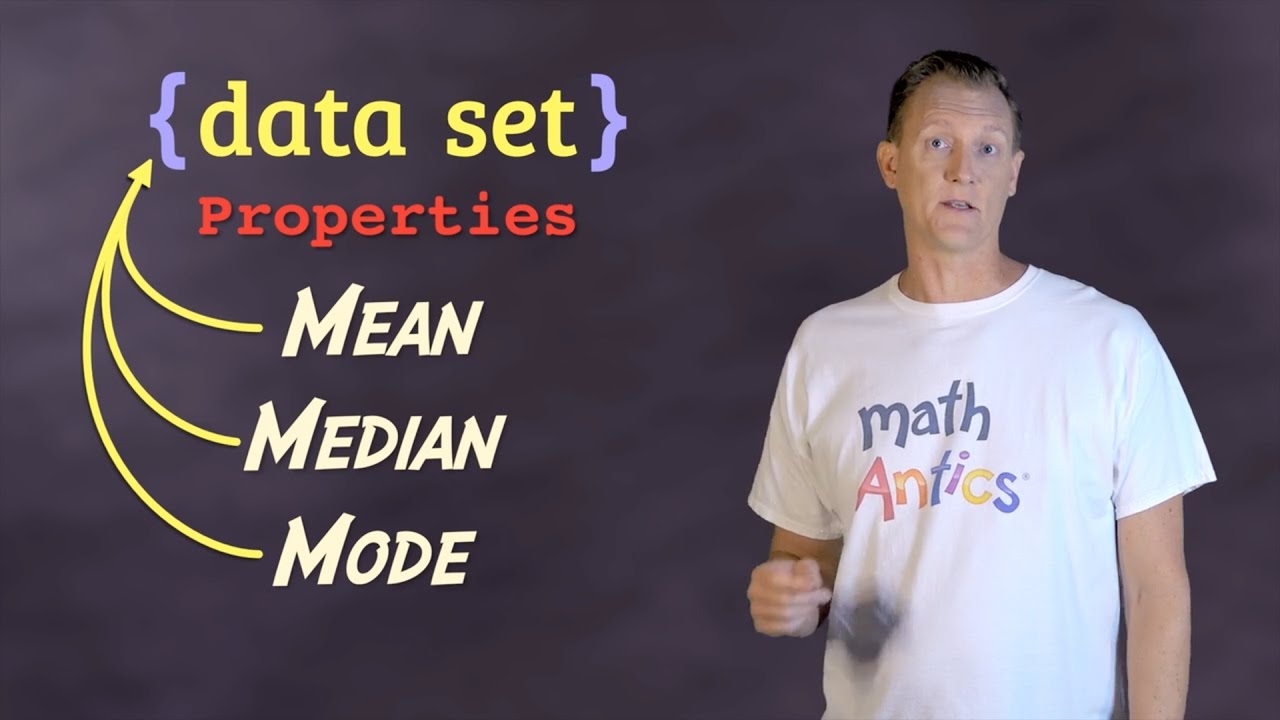
Math Antics - Mean, Median and Mode
This video explains how to calculate the Mean, Median, and Mode, which are three key properties used to understand data sets. It breaks down each concept with clear definitions and step-by-step examples, showing viewers how to find the average, middle value, and most frequent value in a collection of numbers.
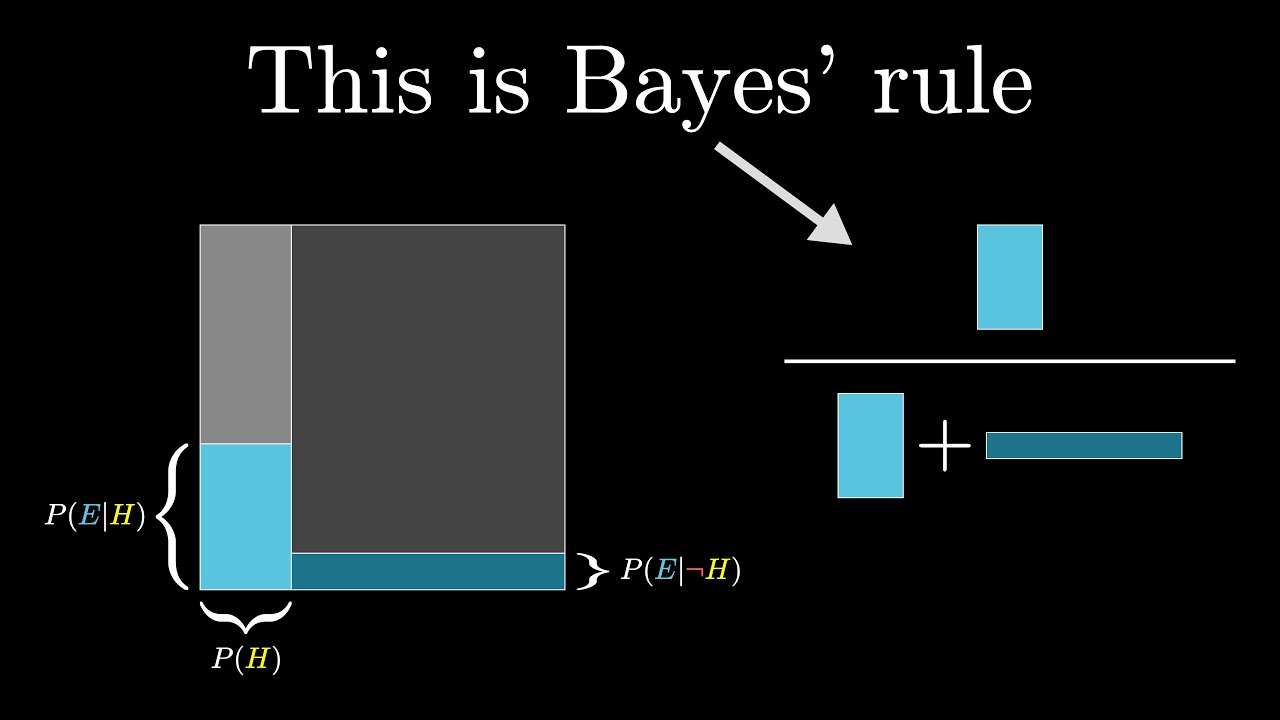
Bayes theorem, the geometry of changing beliefs
This video explains Bayes' theorem, a crucial formula in probability, by starting with its practical application and then delving into its mathematical derivation. It uses an engaging example of a shy person's profession to illustrate how new evidence should update prior beliefs, emphasizing the importance of considering base rates.
Basic Statistics for Kids | Learning Basic Statistics for Elementary Students
This video introduces basic statistics to elementary students by explaining what statistics is and defining key terms like data set, mean, median, mode, and range. It uses a simple example of daily temperatures to demonstrate how to calculate each of these statistical measures and interpret the results.