Struggling to make sense of your sprawling spreadsheets? You're not alone. But what if we told you there's a way to transform that raw data into crystal-clear insights, all for free, right on YouTube?
Key Takeaways
- 1Master Excel Pivot Tables with curated free YouTube tutorials.
- 2Learn to transform raw data into actionable business insights.
- 3Build your first Pivot Table and customize it for deep analysis.
- 4Discover essential companion skills like VLOOKUP for targeted data.
- 5Elevate your business analytics and reporting capabilities.
Who this is for
- If you're a business professional drowning in data and need quick answers.
- If you're a data analyst looking to refine your Excel skills for free.
- If you're a student aiming to build a strong foundation in Excel data analysis.
Start Learning with AI-Powered Video Summaries
Get instant summaries, ask questions, and turn any video into an interactive study session.
Try Querivo Free →Master the Fundamentals: Your First Excel Pivot Table
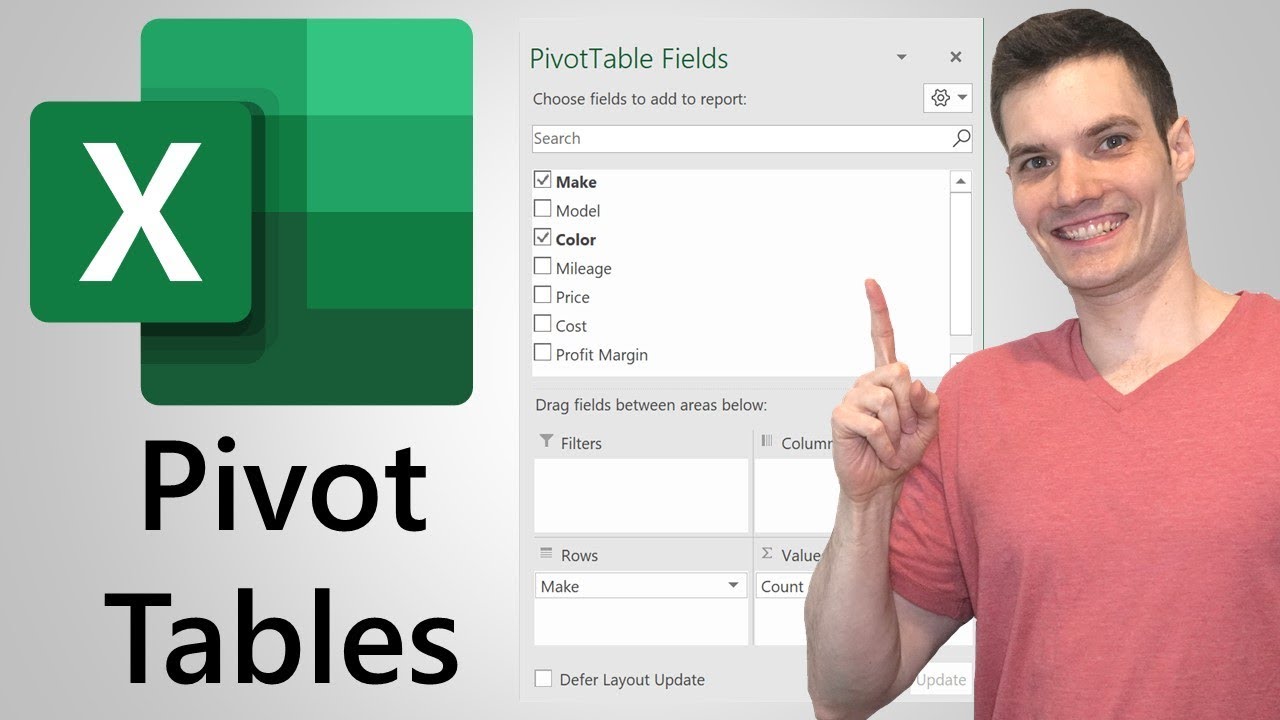
Ever looked at a massive spreadsheet and felt completely overwhelmed? That's where Pivot Tables come in. They're not just another Excel feature; they're a gateway to understanding what your data is actually telling you. This video breaks down exactly why Pivot Tables are so powerful and shows you the very first steps to creating one. You'll learn how to move from your raw, unmanageable data to a structured summary report that actually makes sense.
The creator explains the crucial difference between a standard Excel Table and a Pivot Table – one organizes, the other summarizes and analyzes. It’s a surprisingly important distinction that really clarifies the purpose of Pivot Tables. You'll get a clear, step-by-step walkthrough of converting your data into an official Excel Table (which is key for Pivot Table success!) and then how to insert and configure your very first Pivot Table. Populating it with fields to show summaries in Rows and Values areas is explained simply, so you'll have a basic report ready in minutes. Honestly, it’s a surprisingly effective way to get started.
- Pivot Tables are your key to summarizing raw data effectively.
- Start by converting your data to an Excel Table before creating a Pivot Table.
Effortless Data Analysis: Building & Customizing Pivot Tables
Ready to move beyond the basics? This tutorial is your next stop for really digging into how Pivot Tables work in practice. It’s designed to make the process feel genuinely easy, even if you're new to the concept. You’ll see firsthand how to take your data and shape it into meaningful summaries without getting lost in complicated formulas. It’s all about making data analysis accessible and, dare we say, even a little bit enjoyable.
The process starts with ensuring your data is prepped correctly – converting it to an Excel Table is emphasized again, and for good reason. Then, you’ll learn how to create a Pivot Table from scratch, either from your new Table or a standard data range. The real magic here is the drag-and-drop functionality. You’ll discover how to easily assign fields to Rows, Values, and Columns, letting you structure your analysis on the fly. Plus, you’ll get practical tips on sorting, filtering, and formatting your Pivot Table data, making your reports clear and insightful. Organizing by categories and dates becomes a breeze, helping you spot trends you might otherwise miss.

- Use drag-and-drop to easily structure your Pivot Table analysis.
- Learn to sort, filter, and format your Pivot Table for maximum clarity.
Unlock Deeper Insights: Summarizing & Drilling Down with Pivot Tables
This video really elevates your Pivot Table game. If you’re dealing with large datasets and need to get to the heart of the information quickly, this is where you’ll find your answers. It goes beyond just creating a basic summary; it shows you how to truly explore your data. You’ll see how to get detailed answers from summarized information, which is incredibly powerful for business analytics. It’s the perfect next step after you’ve got the hang of the basics.
You’ll learn how to efficiently summarize extensive tabular data, which is a lifesaver when you have hundreds or even thousands of rows. The tutorial dives deep into the Pivot Table Fields – Rows, Values, Columns, and Filters – and how to use them flexibly for dynamic analysis. But what’s really cool is the drill-down functionality. You’ll discover how to click into a summarized number and immediately see the underlying records that make up that total. How neat is that? Experimenting with interchanging layouts also helps you view your data from entirely different angles, potentially revealing hidden patterns.

- Master Pivot Table Fields for flexible and dynamic data exploration.
- Use the drill-down feature to investigate summarized data and see underlying details.
Enhance Your Data: Mastering VLOOKUP for Targeted Information
Now, while this video isn't strictly about Pivot Tables, it covers a skill that's practically indispensable when you're working with data in Excel, especially alongside Pivot Tables. VLOOKUP is your go-to function for retrieving specific pieces of information from one table and pulling them into another. Think of it as a highly efficient way to match and collect data, often complementing the summarization power of Pivot Tables. Mastering VLOOKUP opens up a whole new level of data manipulation.
This tutorial breaks down the VLOOKUP function with surprising clarity, explaining its syntax and all the necessary arguments. You'll learn how to correctly reference your data tables to ensure accurate lookups, which is where many people get tripped up. The difference between exact and approximate matches is explained clearly, helping you retrieve precisely the information you need. Plus, the creator emphasizes using Excel Tables – a technique we’ve seen before – for dynamic and accurate data referencing, and you'll get a solid grasp on relative vs. absolute cell references, making your formulas far more flexible and robust. It’s a really solid foundation for any data-related task.
- VLOOKUP is essential for retrieving specific data from your tables.
- Use Excel Tables and understand cell references for accurate VLOOKUP implementation.
Your Next Steps
By diving into these free YouTube resources, you're well on your way to becoming a Pivot Table pro. From grasping the fundamental concepts and building your first tables to summarizing vast amounts of data and pulling specific information with VLOOKUP, these videos offer a comprehensive learning path. You've got the tools to start transforming your data analysis game today.
Your Action Items
- ☐Pick one video from above and watch it on Querivo
- ☐Ask questions and check summaries while watching without breaking your flow
- ☐Use the AI chat to clarify confusing parts and deepen understanding
- ☐Come back for more curated videos on topics you want to master
Ready to truly master these Excel skills? Turn any YouTube video into an interactive learning session. Get instant AI summaries and ask questions in real-time, all without leaving the video player.
Turn Any YouTube Video into an Interactive Lesson
Paste any video link, get an instant AI summary, and ask questions in real-time.
Try Querivo Free →Related Videos You Might Enjoy
Looking for more perspectives on this topic? Here are some additional videos worth checking out: