Struggling to make sense of your raw data in Excel? Feeling overwhelmed by spreadsheets that seem to multiply endlessly?
Key Takeaways
- 1Master Excel Pivot Tables with this video guide.
- 2Learn to create and customize powerful data summaries.
- 3Transform raw data into actionable business insights.
- 4Unlock advanced analysis and reporting techniques.
- 5Become proficient in Excel Pivot Tables efficiently.
Who this is for
- If you're wrestling with large datasets and need to find key trends.
- If you're a business professional looking to improve your reporting efficiency.
- If you're a student or analyst needing to extract meaning from data.
Start Learning with AI-Powered Video Summaries
Get instant summaries, ask questions, and turn any video into an interactive study session.
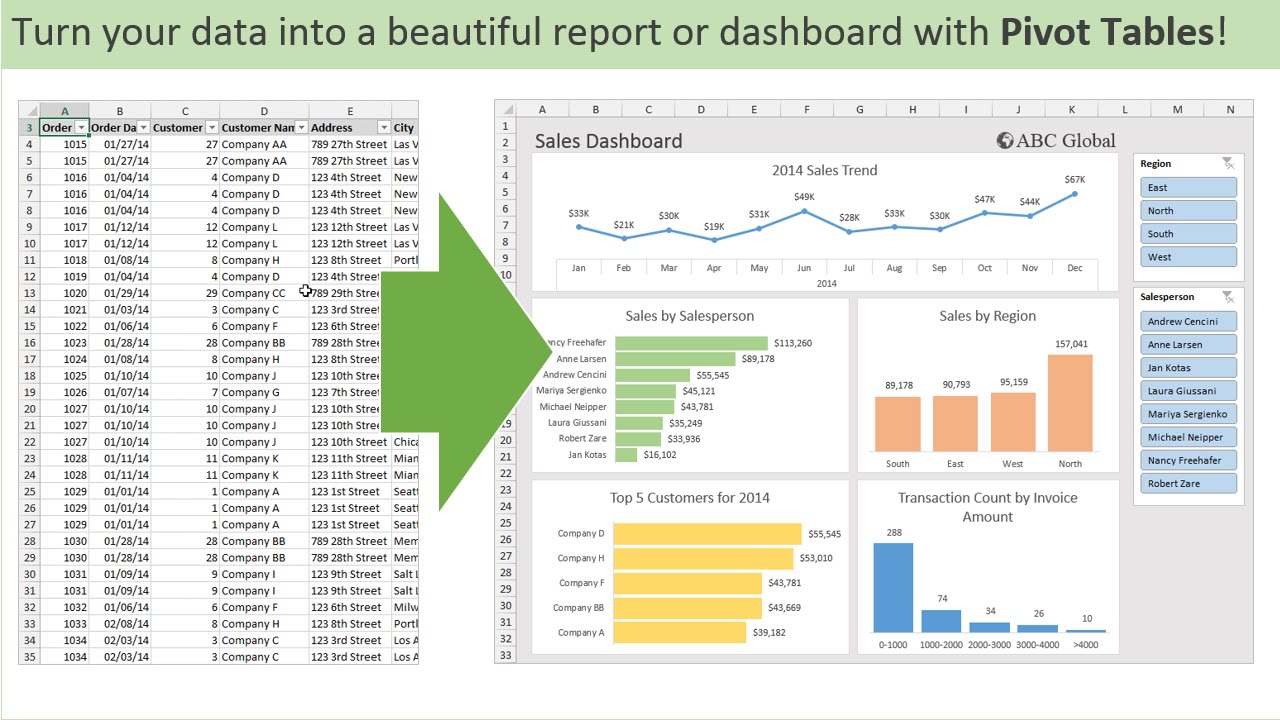
Try Querivo Free →Build Your First Pivot Table with Ease: A Step-by-Step Guide
Ever stared at a massive spreadsheet, wishing there was a magic button to summarize all that information? Well, Pivot Tables are pretty close to that magic. This video is your essential starting point, demystifying the process of creating your very first Pivot Table. It’s not just about clicking buttons; it’s about understanding how to prepare your data so the Pivot Table actually works for you. You'll learn how to convert your raw data into an organized Excel Table – a crucial first step that many people skip, and frankly, it's a game-changer for accuracy.
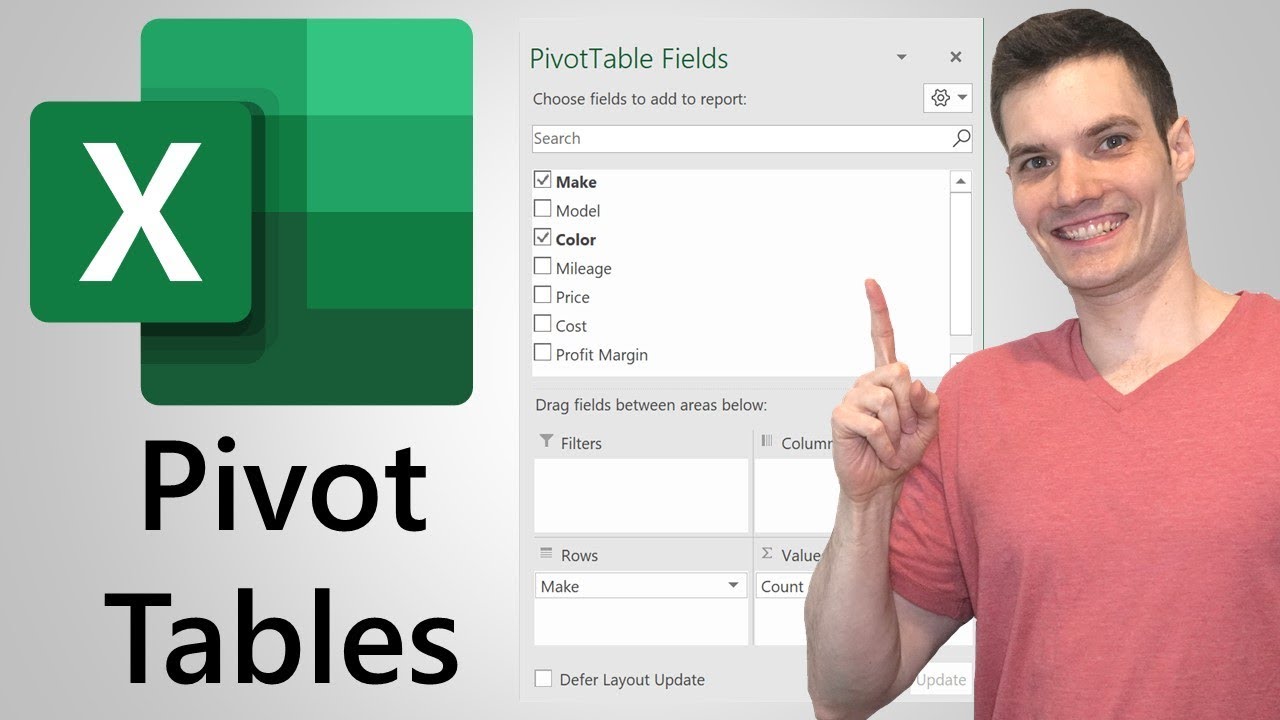
The creator walks you through inserting a Pivot Table, which sounds simple, but knowing where to put it and how to structure it from the get-go makes a huge difference. You’ll get introduced to the fundamental components: Rows, Columns, Values, and Filters. Understanding these four areas is key to unlocking the power of Pivot Tables. For anyone new to this feature, this video is definitely worth your time, especially if you're looking to get your feet wet without feeling completely lost.

- Prepare your data by converting it to an Excel Table.
- Insert your first Pivot Table and understand its core fields.
Mastering Pivot Table Layouts for Clearer Insights
So, you've built your first Pivot Table, but now what? How do you arrange it so it actually tells a story? This video dives into the practical art of Pivot Table layouts. You’ll discover how swapping fields between the Rows, Columns, and Values areas can completely change how you view your data. Want to see total sales by region, then by product? Or maybe average order value per month? This is where you learn how to get those different perspectives.
And it’s not just about structure; it’s about understanding the numbers themselves. The tutorial shows you how to use different summary functions in the Values field – Sum, Count, Average, you name it. Plus, we’ll cover how to use the Filters area to really zero in on specific segments of your data. Practice manipulating these layouts; it's the best way to make sure your reports are not just informative but genuinely insightful. You'll find yourself looking at your data in ways you hadn't even considered before.
- Experiment with field placement for different data views.
- Utilize various summary functions (Sum, Count, Average) in the Values field.
Unlocking Data Details: The Power of Drill-Down and Customization
Sometimes, a summarized number just isn't enough. You need to see the details behind that total. This is where the interactive magic of Pivot Tables truly shines. This video shows you exactly how to ‘drill down’ into your summarized data. Click on a grand total, and bam – Excel shows you all the individual records that make up that number. It’s incredibly helpful for fact-checking and deeper investigation.
But the customization doesn't stop there. You'll also learn how to tweak the value field settings. For instance, if you've been looking at sums, you can easily switch to averages or percentages without rebuilding the whole table. This level of flexibility means you can really tailor your analysis to answer specific questions. Mastering these interactive and customization features means you're not just reporting data; you're truly exploring it.
- Learn to drill down into summarized data to view underlying records.
- Customize value field settings for different calculations like Average or Percentage.
Advanced Pivot Table Techniques for Powerful Reporting
Ready to take your Pivot Table skills to the next level? If you’re looking to move beyond basic summaries and create truly dynamic reports, this video is for you. We'll explore some more advanced techniques that can seriously elevate your data analysis game. Think interactive dashboards and custom calculations that go beyond the standard functions.
While the specific features covered can vary, you'll often find tutorials like this introducing you to powerful tools like slicers and timelines. These allow for super intuitive filtering, making your reports interactive and easy for others to use. Plus, learning about calculated fields and items lets you create custom metrics on the fly – perfect for unique business scenarios. Applying these advanced skills means you can generate comprehensive and dynamic reports that really impress. It's definitely worth watching if you want to go from basic user to a Pivot Table power user.
- Explore advanced data analysis and interactive filtering techniques.
- Discover how to create custom calculations for specific reporting needs.
Your Next Steps
By following these curated YouTube tutorials, you've gained the essential skills to create, customize, and leverage Excel Pivot Tables for effective data summarization and analysis. From basic setup to interactive exploration, you're now equipped to transform your spreadsheets into powerful insights.
Your Action Items
- ☐Pick one video from above and watch it on Querivo
- ☐Ask questions and check summaries while watching without breaking your flow
- ☐Use the AI chat to clarify confusing parts and deepen understanding
- ☐Come back for more curated videos on topics you want to master
Ready to put your new skills to the test? Start by applying the techniques from these videos to your own datasets in Excel!
Turn Any YouTube Video into an Interactive Lesson
Paste any video link, get an instant AI summary, and ask questions in real-time.
Try Querivo Free →Related Videos You Might Enjoy
Looking for more perspectives on this topic? Here are some additional videos worth checking out: