Are you drowning in data but starved for insights? In today's fast-paced business world, making informed decisions is paramount, and Microsoft Excel remains an indispensable tool for unlocking the power of your business data. While many are familiar with basic Excel functions, truly leveraging its capabilities for in-depth business analysis can be a game-changer for professionals in finance, operations, and management. This article curates essential YouTube tutorials designed to elevate your Excel skills from everyday tasks to strategic decision-making. We'll guide you through four highly recommended YouTube videos that will equip you with advanced techniques for data manipulation, financial modeling, and impactful reporting, ultimately empowering you to drive better business outcomes.
Key Takeaways
- 1Unlock Excel's power for business analysis.
- 2Master data manipulation & financial modeling.
- 3Create compelling business reports.
- 4Drive better business outcomes with data.
- 5Elevate your decision-making skills.
Who this is for
- If you're a business analyst struggling to extract actionable insights from spreadsheets
- If you're a finance professional looking to build robust financial models
- If you're a manager or entrepreneur aiming to make data-driven decisions
Start Learning with AI-Powered Video Summaries
Get instant summaries, ask questions, and turn any video into an interactive study session.
Try Querivo Free →Optimize Supply Chain Operations with Excel Hacks
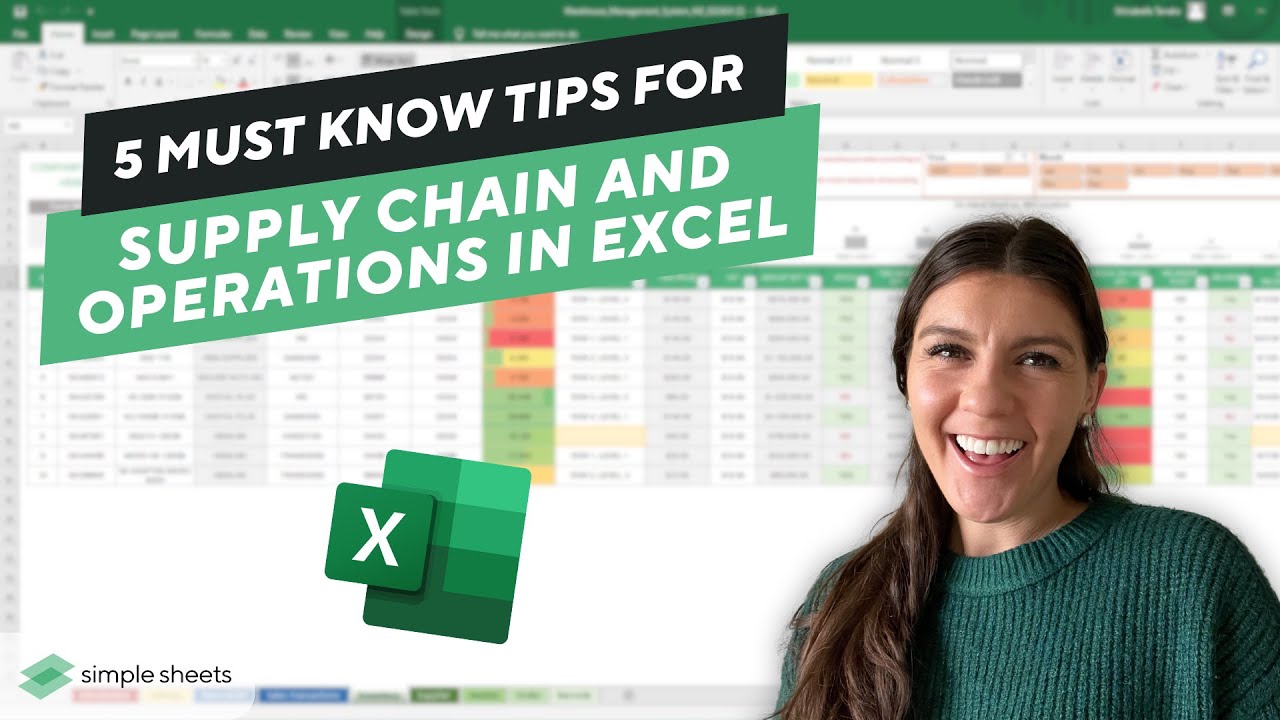
For professionals wrestling with the complexities of supply chain management, efficiency and accuracy are everything. This video dives into practical Excel techniques that can significantly streamline operations. You'll discover how to tackle common challenges like inventory management and demand forecasting with surprising ease. It's about moving beyond basic data entry to genuinely strategic analysis, directly within the tool you already use.
The creator demonstrates how to implement ABC classification for inventory optimization, a really neat way to prioritize stock based on value. They'll show you how to use functions like Percentile.exc and nested IF statements, which might sound complex, but the video breaks them down effectively. Plus, managing reorder points becomes far less of a headache with tips using SUMIF, IF, and Conditional Formatting. This is the kind of stuff that saves time and prevents costly errors.
Looking to speed up data retrieval? This tutorial highlights the power of XLOOKUP and Data Validation, making it much easier to pull the right information when you need it. And for predicting future needs, the built-in Excel Forecasting Tool gets a solid mention, offering a glimpse into predictive trend analysis. Honestly, if you’re in supply chain or operations, watching this video is pretty much a no-brainer for boosting your analytical firepower.

- Streamline inventory using ABC classification and reorder points.
- Boost data lookup efficiency with XLOOKUP and Data Validation.
Build a Foundation in Financial Modeling for Smart Business Planning
Financial modeling is the bedrock of sound business planning, and this video focuses on getting you that essential foundation using Excel. If you’ve ever felt intimidated by creating forecasts, budgets, or evaluating different business scenarios, this is your starting point. It’s not about advanced, complex models right away, but understanding the fundamental building blocks that make a financial model robust and adaptable.
The creator walks you through the core components, demystifying what goes into a well-structured financial model. You’ll pick up on best practices for ensuring your models are both flexible enough to change and dynamic enough to reflect real-time data. This is super important because business conditions rarely stay static, right? Understanding this flexibility prevents your models from becoming outdated quickly.
Crucially, this tutorial covers applying key Excel functions specifically for cash flow forecasting and valuation – two absolutely vital metrics for any business. You'll also learn how to develop various scenarios, allowing you to assess your business's performance under different potential conditions. Whether you're projecting sales, costs, or investment returns, this video equips you with the knowledge to build models that truly inform decision-making.

- Understand the core components of a flexible financial model.
- Learn Excel functions for cash flow forecasting and valuation.
Study This Video Deeper
Get an AI summary and ask questions about confusing parts in real-time.
Open in Querivo →Transform Data into Insight: Advanced Excel Reporting and Visualization
Turning raw data into compelling reports that stakeholders can actually understand is a skill in itself. This video tackles that challenge head-on, guiding you through how to create visually appealing and insightful business reports using advanced Excel techniques. It's about making your data tell a story, a story that drives action and supports strategic objectives. If you want your reports to pop and your insights to be clear, this is the one to watch.
You’ll explore advanced charting techniques that go beyond the standard bar or line graphs, helping you represent complex data in a way that’s immediately understandable. And for those who need to keep a pulse on performance, the video touches on implementing dynamic dashboards. These are game-changers for real-time monitoring, allowing you to spot trends and anomalies as they happen, not weeks later.
Conditional formatting also gets a spotlight, and for good reason! It’s a surprisingly powerful tool for highlighting key trends, outliers, or areas needing attention. The instructor emphasizes structuring your reports for maximum clarity, which is absolutely critical for ensuring your message lands with anyone who needs to make a decision based on your analysis. This video is a must-watch for anyone who needs to communicate data effectively.

- Utilize advanced charting for impactful data representation.
- Implement dynamic dashboards for real-time monitoring.
Dig Deeper: Advanced Excel for Business Data Analysis
Ready to move beyond the basics and really uncover the hidden gems within your business data? This section delves into more advanced data analysis techniques in Excel that can unlock deeper insights and extract significantly more value from your spreadsheets. It’s for those who know Excel can do more, and they're eager to learn how. This video is a fantastic resource for anyone aiming to become a more sophisticated data analyst.
PivotTables and PivotCharts are central here, and rightly so. They’re incredibly powerful tools for summarizing and analyzing massive datasets without getting bogged down in complex formulas. You'll learn how to leverage them effectively to spot patterns, aggregate information, and get a high-level overview of your data in minutes. Plus, the inclusion of Power Query for data cleaning and transformation is invaluable. Seriously, learning Power Query can save you hours of tedious manual work.
The creator also guides you through applying statistical functions, which adds another layer to your data understanding. This isn't just about looking at numbers; it's about interpreting what they mean for your business. Identifying and interpreting key performance indicators (KPIs) within your data is also a critical focus, ensuring your analysis directly ties back to business objectives. This video really equips you for more in-depth Excel business analysis.

- Explore PivotTables and PivotCharts for powerful data summarization.
- Learn Power Query for efficient data cleaning and transformation.
Your Next Steps
By mastering the techniques demonstrated in these curated YouTube videos, you can transform your Excel proficiency into a powerful asset for business analysis, leading to more informed decisions and strategic advantages. Ready to elevate your business analysis game? Start exploring these Excel tutorials today and unlock your data's full potential.
Your Action Items
- ☐Pick one video from above and watch it on Querivo
- ☐Ask questions and check summaries while watching without breaking your flow
- ☐Use the AI chat to clarify confusing parts and deepen understanding
- ☐Come back for more curated videos on topics you want to master
Turn any YouTube video into an interactive lesson. Paste any video link, get an instant AI summary, and ask questions in real-time.
Turn Any YouTube Video into an Interactive Lesson
Paste any video link, get an instant AI summary, and ask questions in real-time.
Try Querivo Free →Related Videos You Might Enjoy
Looking for more perspectives on this topic? Here are some additional videos worth checking out:
Master Data Analysis on Excel in Just 10 Minutes

20 Excel Shortcuts to Save You HOURS of Work

Can You Pass This Excel Interview Test?

5 Excel Hacks Every Supply Chain and Operations Pro Should know
This video demonstrates five essential Excel hacks for supply chain and operations professionals, covering forecasting, ABC classification, reorder point management, efficient data lookup with XLOOKUP, and conditional formatting. These techniques aim to help users optimize inventory, predict trends, and make informed decisions for strategic success.