Are you tired of staring at cryptic error messages and endless console.log statements in your JavaScript projects? It's a frustrating reality for many developers, turning what should be a creative process into a tedious hunt for elusive bugs.
Key Takeaways
- 1Master JavaScript debugging with curated YouTube guides.
- 2Go beyond `console.log` with powerful browser and IDE tools.
- 3Learn to prevent bugs before they happen.
- 4Debug efficiently and write more robust code.
- 5Save hours and boost your development speed.
Who this is for
- If you're constantly battling JavaScript errors and seeking faster solutions
- If you want to level up your problem-solving skills with effective debugging techniques
- If you're a beginner to intermediate JavaScript developer ready to move past basic `console.log`
Start Learning with AI-Powered Video Summaries
Get instant summaries, ask questions, and turn any video into an interactive study session.
Try Querivo Free →Build a Bug-Proof Foundation with Universal Debugging Techniques
It's easy to jump straight into trying to fix a bug the moment it appears, but sometimes the best defense is a good offense. This video introduces foundational, language-agnostic debugging strategies that can help prevent bugs before they even surface. Understanding errors and leveraging fundamental tools is key to writing more robust code from the start.
We'll cover how to decode documentation and error messages for quick insights, which is surprisingly effective. Plus, you'll learn about logging strategies that go way beyond simple console.log – think more insightful and targeted. The real game-changer here is understanding the power of debuggers and breakpoints for precise issue identification. And don't forget the proactive stuff: embracing reproduction, testing, and static analysis can seriously reduce the number of bugs you encounter in the first place. This is essential knowledge for anyone wanting to debug JS code effectively.
- Decode documentation and error messages for immediate understanding.
- Implement logging and debugger strategies to pinpoint issues.
- Proactively prevent bugs with testing and static analysis.
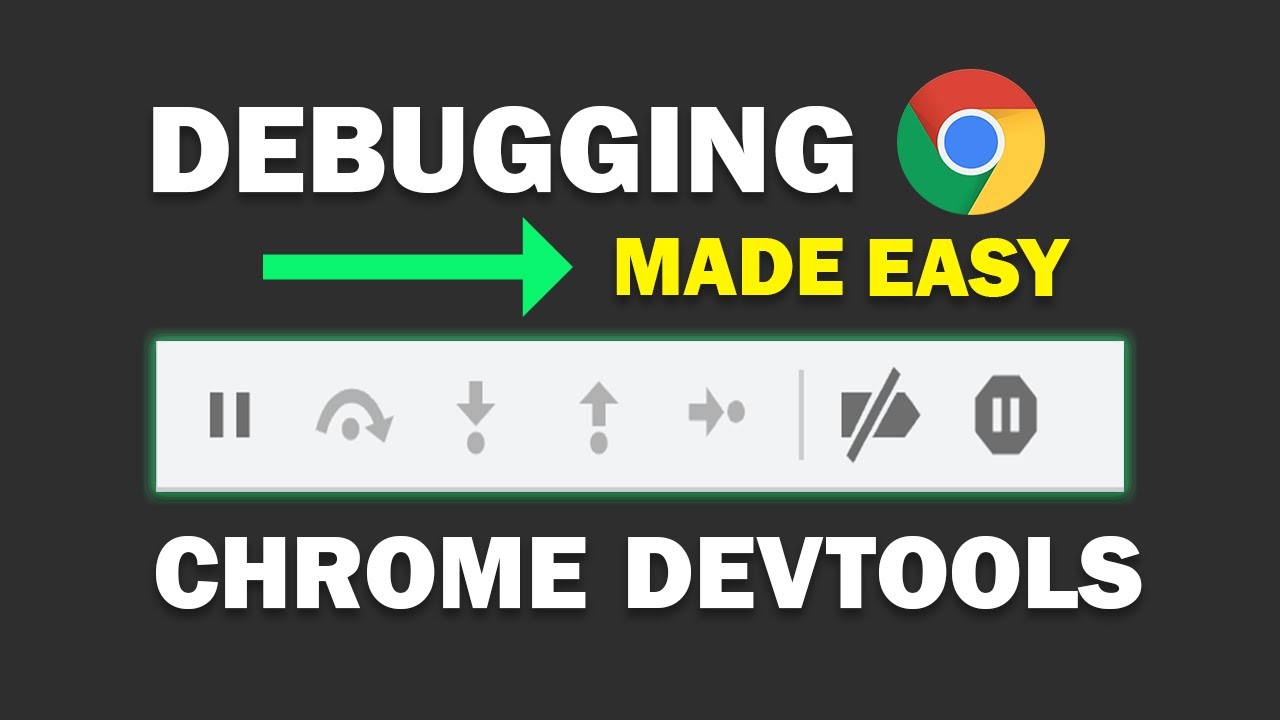
Unlock Chrome DevTools for Powerful JavaScript Debugging
Sure, console.log has its place, but are you really getting the most out of your JavaScript debugging? This video is a fantastic practical guide to really harnessing the power of Chrome's built-in developer tools. It's designed to move you past those endless log statements and into a more efficient debugging workflow.
You'll learn to navigate the Chrome DevTools interface specifically for JavaScript debugging, which might seem daunting at first, but the step-by-step approach makes it surprisingly approachable. Setting and effectively using various types of breakpoints – from simple line-of-code ones to more specific event listener breakpoints – is a crucial skill. Plus, mastering code stepping controls allows you to trace exactly how your code is executing, step by step. Inspecting variables and scopes, and using Watch expressions to monitor state, gives you a crystal-clear view of what's happening under the hood.
- Navigate and utilize Chrome DevTools for efficient JS debugging.
- Master breakpoints and code stepping for detailed execution tracing.
- Inspect variables and scopes to understand program state.
Study This Video Deeper
Get an AI summary and ask questions about confusing parts in real-time.
Open in Querivo →Streamline Your Workflow with VS Code's Integrated Debugger
If you're using Visual Studio Code for your development, you're missing out if you're not leveraging its integrated debugger. This video really highlights how to keep your development and debugging process within a single, efficient environment, which is especially handy when you're working with frameworks like React or Angular. Why switch contexts when you can do it all right there?
This tutorial walks you through configuring and utilizing the VS Code debugger for JavaScript, React, and Angular projects, even with TypeScript. You'll learn to set breakpoints and step through your code directly within your IDE, making the entire process feel much more fluid. Understanding the launch.json configuration is key here; it allows you to tailor debugging sessions for different project types, ensuring you're always set up for success. Debugging complex applications without leaving your editor is definitely a productivity booster, and this video shows you exactly how to achieve that.
- Configure and use the VS Code debugger for JS, React, and Angular.
- Step through code and set breakpoints directly within your IDE.
- Optimize your workflow by debugging without leaving your editor.
Master Chrome DevTools for Advanced Code Troubleshooting
We've touched on Chrome DevTools, but this video really dives deeper, showcasing advanced features and techniques that will truly help you stop relying on console.log and gain much deeper insights into your code's execution. It's about moving from basic troubleshooting to sophisticated code analysis.
This tutorial explores the Chrome DevTools Sources panel in detail, which is where the magic happens for in-depth debugging. You'll get a solid grasp on utilizing breakpoints effectively to pause execution precisely at critical points in your code. Plus, the power of Watch Expressions is really emphasized; these allow you to continuously monitor specific variable values as your code runs, giving you real-time feedback. Analyzing the Call Stack is another vital technique covered, helping you understand the history of function calls and how you arrived at a particular point in your code. This is essential for effective javascript debugging youtube content.
- Deep dive into the Chrome DevTools Sources panel for debugging.
- Utilize Watch Expressions to monitor variable values dynamically.
- Analyze the Call Stack to understand function execution flow.
Your Next Steps
By incorporating the techniques and tools shown in these videos, you'll significantly improve your ability to diagnose and resolve JavaScript bugs. This leads to faster development cycles and, most importantly, more stable and reliable applications. Remember, debugging isn't just about fixing problems; it's a skill that sharpens with practice and the right approach. You've got the resources to become a much more effective problem solver.
Your Action Items
- ☐Pick one video from above and watch it on Querivo
- ☐Ask questions and check summaries while watching without breaking your flow
- ☐Use the AI chat to clarify confusing parts and deepen understanding
- ☐Come back for more curated videos on topics you want to master
These YouTube videos offer invaluable insights and practical guidance for any JavaScript developer looking to enhance their debugging prowess. Start applying these strategies today and experience the difference in your development workflow!
Turn Any YouTube Video into an Interactive Lesson
Paste any video link, get an instant AI summary, and ask questions in real-time.
Try Querivo Free →Related Videos You Might Enjoy
Looking for more perspectives on this topic? Here are some additional videos worth checking out:
Tips and Tricks for Debugging JavaScript
This video demonstrates how to move beyond basic console.log statements for JavaScript debugging. It explores advanced console methods like dir and table for better data visualization, and introduces debugging techniques within Chrome and VS Code.
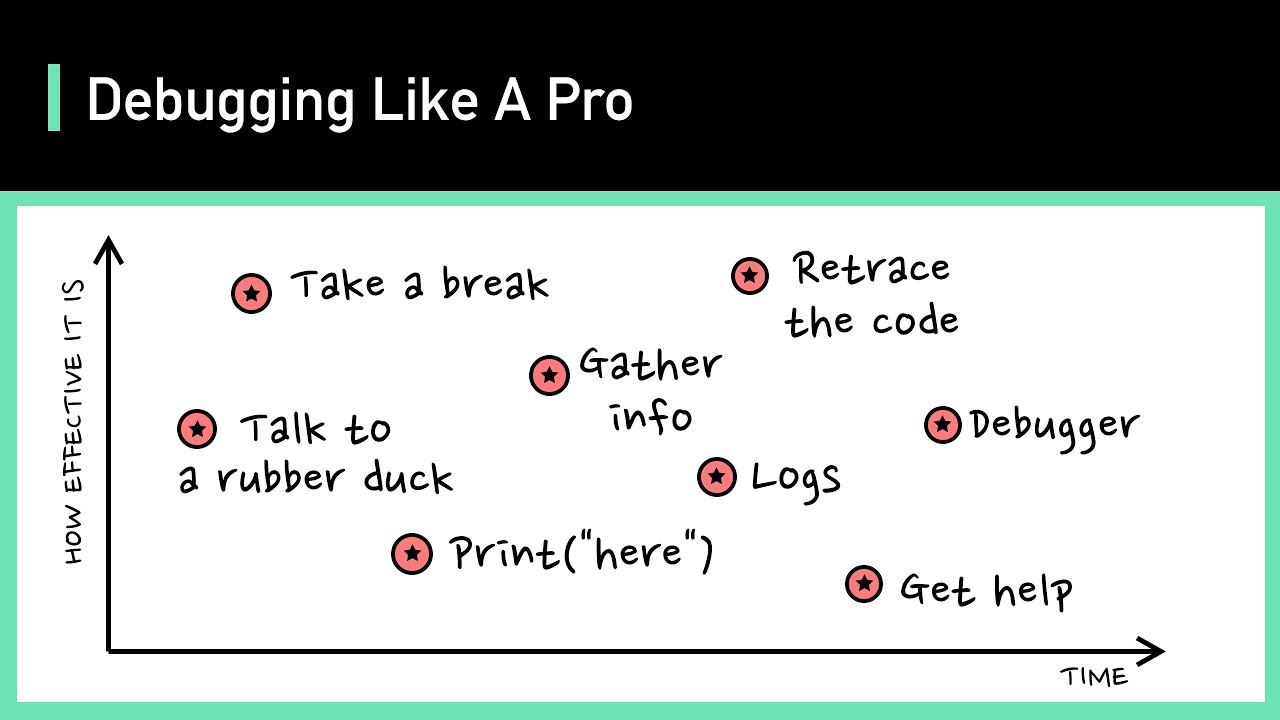
Debugging Like A Pro
This video offers a systemic approach to debugging, emphasizing the importance of a disciplined mindset and practical strategies. It covers how to handle bug reports, investigate issues in reproducible environments, and strategies for when reproduction is difficult, concluding with tips for when developers are completely stuck.
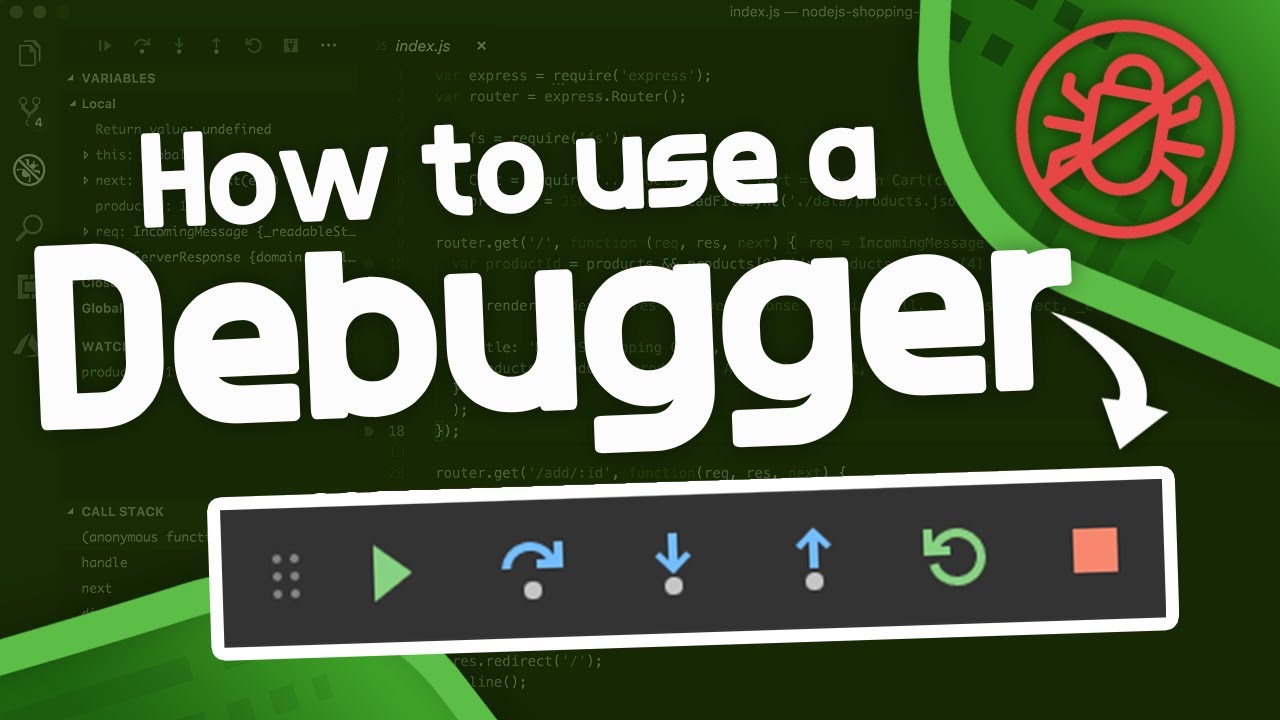
How to Use a Debugger - Debugger Tutorial
This video provides a comprehensive tutorial on using debuggers in programming, specifically demonstrating with VS Code and Python. It explains the core functionality of a debugger, contrasting it with print debugging, and details essential commands like breakpoints, step over, step into, and step out.
Master JavaScript Debugging: Tools, Techniques & Best Practices
This video provides a comprehensive guide to mastering JavaScript debugging, covering essential tools like the console object and breakpoints. It explains techniques for stepping through code, monitoring variables, and understanding the call stack, along with best practices for debugging in production.